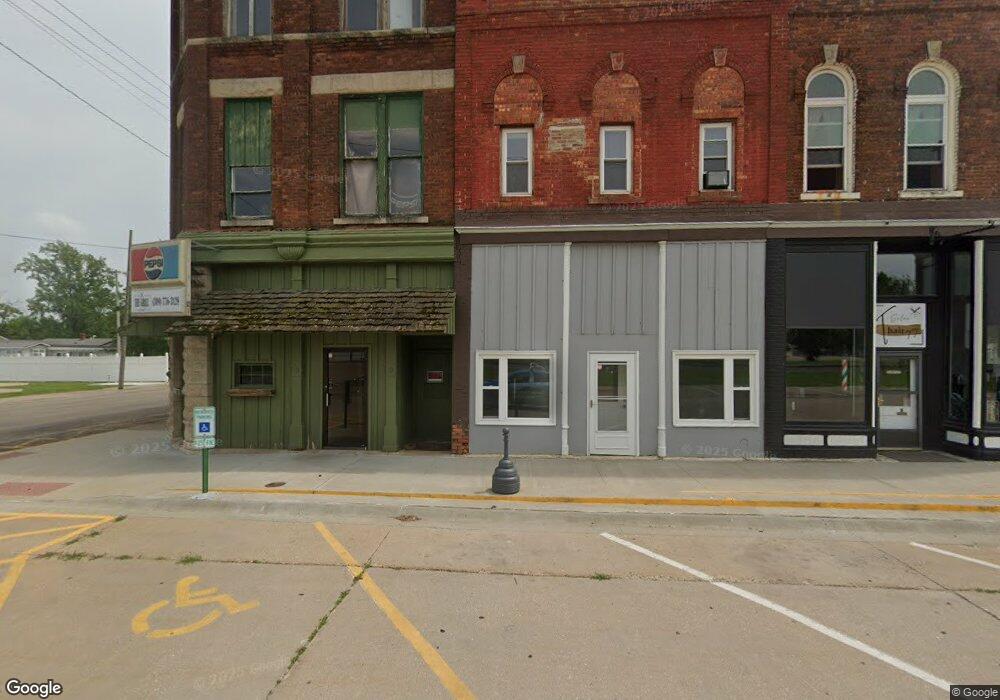
134 Market St Colchester, IL 62326
Estimated Value: $48,152
--
Bed
--
Bath
5,367
Sq Ft
$9/Sq Ft
Est. Value
About This Home
This home is located at 134 Market St, Colchester, IL 62326 and is currently estimated at $48,152, approximately $8 per square foot. 134 Market St is a home located in McDonough County.
Ownership History
Date
Name
Owned For
Owner Type
Purchase Details
Closed on
Aug 17, 2021
Sold by
Irish Kathy B and Irish Ralph E
Bought by
Knox Todd A and Knox Margaret A
Current Estimated Value
Purchase Details
Closed on
Jul 27, 2007
Sold by
Beck Wendell I
Bought by
Irish Kathy B and Irish Ralph E
Purchase Details
Closed on
Jun 23, 2005
Sold by
Colchester State Bank
Bought by
Beck Wendell I
Home Financials for this Owner
Home Financials are based on the most recent Mortgage that was taken out on this home.
Original Mortgage
$36,000
Interest Rate
5.75%
Mortgage Type
Commercial
Purchase Details
Closed on
Apr 30, 2005
Sold by
Creasey Thomas W and Creasey Geri L
Bought by
Colchester State Bank
Home Financials for this Owner
Home Financials are based on the most recent Mortgage that was taken out on this home.
Original Mortgage
$36,000
Interest Rate
5.75%
Mortgage Type
Commercial
Create a Home Valuation Report for This Property
The Home Valuation Report is an in-depth analysis detailing your home's value as well as a comparison with similar homes in the area
Home Values in the Area
Average Home Value in this Area
Purchase History
| Date | Buyer | Sale Price | Title Company |
|---|---|---|---|
| Knox Todd A | $38,000 | Attorney | |
| Irish Kathy B | $16,500 | None Available | |
| Beck Wendell I | $32,000 | None Available | |
| Colchester State Bank | -- | None Available |
Source: Public Records
Mortgage History
| Date | Status | Borrower | Loan Amount |
|---|---|---|---|
| Previous Owner | Beck Wendell I | $36,000 |
Source: Public Records
Tax History Compared to Growth
Tax History
| Year | Tax Paid | Tax Assessment Tax Assessment Total Assessment is a certain percentage of the fair market value that is determined by local assessors to be the total taxable value of land and additions on the property. | Land | Improvement |
|---|---|---|---|---|
| 2024 | $809 | $7,928 | $1,491 | $6,437 |
| 2023 | $773 | $7,501 | $1,411 | $6,090 |
| 2022 | $780 | $7,501 | $1,411 | $6,090 |
| 2021 | $651 | $6,286 | $1,411 | $4,875 |
| 2020 | $647 | $7,697 | $1,411 | $6,286 |
| 2019 | $653 | $6,390 | $1,434 | $4,956 |
| 2018 | $649 | $6,510 | $1,461 | $5,049 |
| 2017 | $657 | $6,510 | $1,461 | $5,049 |
| 2016 | $657 | $6,510 | $1,461 | $5,049 |
| 2015 | $664 | $6,510 | $1,461 | $5,049 |
| 2014 | $642 | $6,510 | $1,461 | $5,049 |
| 2013 | $625 | $6,510 | $1,461 | $5,049 |
Source: Public Records
Map
Nearby Homes
- 106 S Fulton St
- 105 E South St
- 209 E South St
- 101 E South St
- 110 E South St
- 213 E South St
- 202 E South St
- 102 W South St
- 106 E South St
- 102 E South St
- 106 W South St
- 302 E Market St
- 205 S Hun St
- 109 W Market St
- 214 E South St
- 101 W South St
- 209 E Depot St
- 110 W South St
- 207 S Fulton St
- 306 E Market St