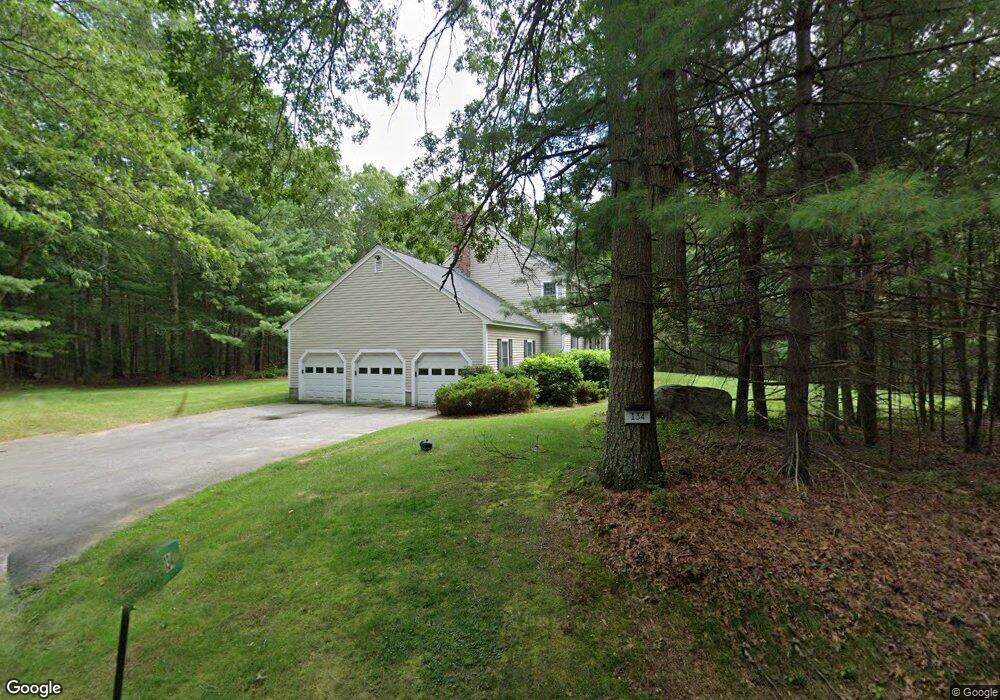
134 Martin St Carlisle, MA 01741
Estimated Value: $1,415,332 - $1,836,000
4
Beds
4
Baths
4,254
Sq Ft
$374/Sq Ft
Est. Value
About This Home
This home is located at 134 Martin St, Carlisle, MA 01741 and is currently estimated at $1,589,583, approximately $373 per square foot. 134 Martin St is a home located in Middlesex County with nearby schools including Carlisle School.
Ownership History
Date
Name
Owned For
Owner Type
Purchase Details
Closed on
Oct 3, 1994
Sold by
Robertson Thomas and Robertson Darlene
Bought by
Kim Yeong and Kim Susan
Current Estimated Value
Create a Home Valuation Report for This Property
The Home Valuation Report is an in-depth analysis detailing your home's value as well as a comparison with similar homes in the area
Home Values in the Area
Average Home Value in this Area
Purchase History
| Date | Buyer | Sale Price | Title Company |
|---|---|---|---|
| Kim Yeong | $425,000 | -- | |
| Kim Yeong | $425,000 | -- |
Source: Public Records
Mortgage History
| Date | Status | Borrower | Loan Amount |
|---|---|---|---|
| Open | Kim Yeong | $180,000 | |
| Closed | Kim Yeong | $100,000 |
Source: Public Records
Tax History Compared to Growth
Tax History
| Year | Tax Paid | Tax Assessment Tax Assessment Total Assessment is a certain percentage of the fair market value that is determined by local assessors to be the total taxable value of land and additions on the property. | Land | Improvement |
|---|---|---|---|---|
| 2025 | $15,838 | $1,201,700 | $582,800 | $618,900 |
| 2024 | $15,315 | $1,148,900 | $539,200 | $609,700 |
| 2023 | $14,709 | $1,039,500 | $526,400 | $513,100 |
| 2022 | $14,596 | $884,600 | $427,800 | $456,800 |
| 2021 | $8,789 | $884,600 | $427,800 | $456,800 |
| 2020 | $14,973 | $815,500 | $340,700 | $474,800 |
| 2019 | $14,670 | $802,100 | $340,700 | $461,400 |
| 2018 | $14,314 | $787,800 | $340,700 | $447,100 |
| 2017 | $5,620 | $787,600 | $340,700 | $446,900 |
| 2016 | $13,547 | $787,600 | $340,700 | $446,900 |
| 2015 | $13,591 | $715,300 | $327,600 | $387,700 |
| 2014 | $13,333 | $715,300 | $327,600 | $387,700 |
Source: Public Records
Map
Nearby Homes
- 12 Martin St
- 6 Sierra Dr
- 5 Carriage Dr
- 1056 Curve St
- 9 Donna Rd
- 10 Parlee Rd
- 20 4th Ln
- 8 Kay's Walk Unit 13
- 14 Kay's Walk
- 6 Kay's Walk Unit 6
- 6 Kay's Walk
- 2 Kay's Walk Unit 18
- 4 Kay's Walk Unit 15
- 3 Kay's Walk
- 15 Kay's Walk
- 1 Kay's Walk Unit 1
- 1 Kay's Walk
- 13 Kay's Walk
- 15 Kay's Walk Unit 4
- 3 Kay's Walk Unit 3