Estimated Value: $92,227 - $116,000
3
Beds
1
Bath
1,320
Sq Ft
$76/Sq Ft
Est. Value
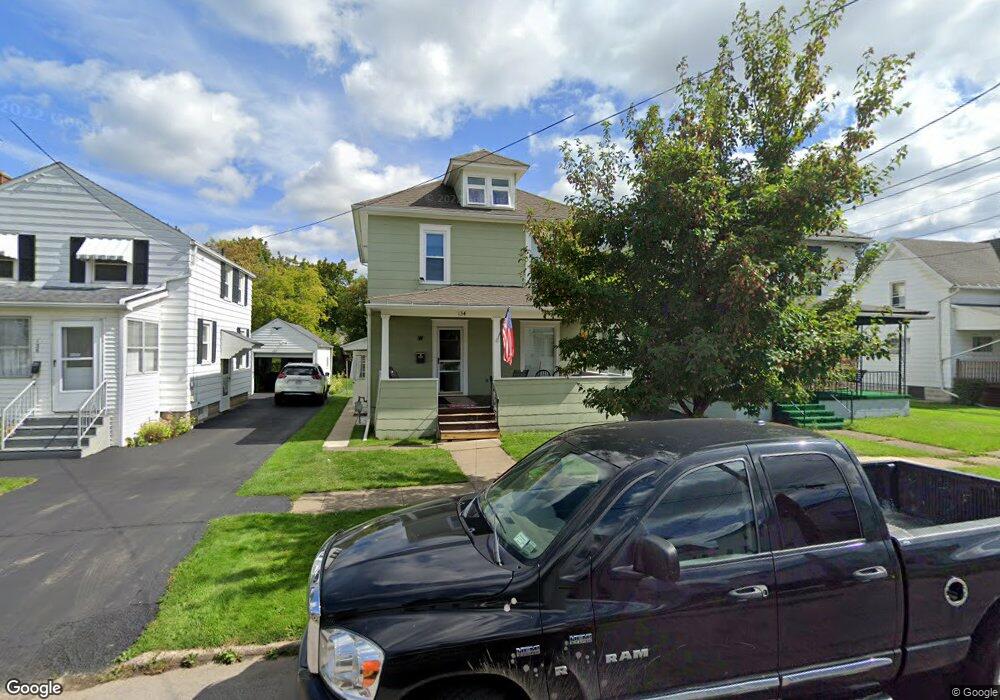
About This Home
This home is located at 134 N 11th St, Olean, NY 14760 and is currently estimated at $99,807, approximately $75 per square foot. 134 N 11th St is a home located in Cattaraugus County with nearby schools including Olean Intermediate-Middle School, Olean Senior High School, and Southern Tier Catholic School.
Ownership History
Date
Name
Owned For
Owner Type
Purchase Details
Closed on
Sep 8, 2005
Sold by
Rohrabacher Michelle
Bought by
Wojtanik John
Current Estimated Value
Home Financials for this Owner
Home Financials are based on the most recent Mortgage that was taken out on this home.
Original Mortgage
$45,967
Outstanding Balance
$4,529
Interest Rate
5.79%
Mortgage Type
Purchase Money Mortgage
Estimated Equity
$95,278
Purchase Details
Closed on
Dec 3, 1996
Sold by
Estate - Utecht Catherine A
Bought by
Rohrabacher Michelle L
Create a Home Valuation Report for This Property
The Home Valuation Report is an in-depth analysis detailing your home's value as well as a comparison with similar homes in the area
Home Values in the Area
Average Home Value in this Area
Purchase History
| Date | Buyer | Sale Price | Title Company |
|---|---|---|---|
| Wojtanik John | $45,000 | Daniel Palumbo | |
| Rohrabacher Michelle L | $32,000 | -- |
Source: Public Records
Mortgage History
| Date | Status | Borrower | Loan Amount |
|---|---|---|---|
| Open | Wojtanik John | $45,967 |
Source: Public Records
Tax History
| Year | Tax Paid | Tax Assessment Tax Assessment Total Assessment is a certain percentage of the fair market value that is determined by local assessors to be the total taxable value of land and additions on the property. | Land | Improvement |
|---|---|---|---|---|
| 2024 | $3,293 | $53,500 | $3,200 | $50,300 |
| 2023 | $1,922 | $53,500 | $3,200 | $50,300 |
| 2022 | $1,948 | $53,500 | $3,200 | $50,300 |
| 2021 | $2,102 | $53,500 | $3,200 | $50,300 |
| 2020 | $1,221 | $53,500 | $3,200 | $50,300 |
| 2019 | $683 | $53,500 | $3,200 | $50,300 |
| 2018 | $1,366 | $53,500 | $3,200 | $50,300 |
| 2017 | $734 | $53,500 | $3,200 | $50,300 |
| 2016 | $720 | $53,500 | $3,200 | $50,300 |
| 2015 | -- | $53,500 | $3,200 | $50,300 |
| 2014 | -- | $53,500 | $3,200 | $50,300 |
Source: Public Records
Map
Nearby Homes
Your Personal Tour Guide
Ask me questions while you tour the home.