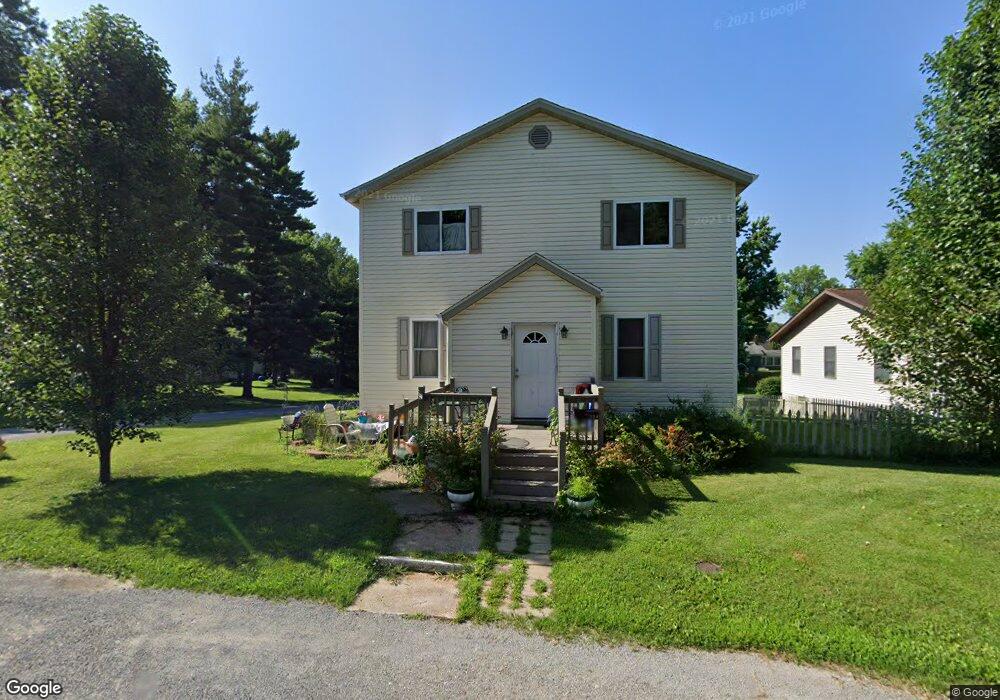
134 N 30th St Belleville, IL 62226
Estimated Value: $128,000 - $153,054
Studio
--
Bath
960
Sq Ft
$149/Sq Ft
Est. Value
About This Home
This home is located at 134 N 30th St, Belleville, IL 62226 and is currently estimated at $143,014, approximately $148 per square foot. 134 N 30th St is a home located in St. Clair County with nearby schools including Union Elementary School, West Jr High School, and Governor French Academy.
Ownership History
Date
Name
Owned For
Owner Type
Purchase Details
Closed on
Mar 13, 2009
Sold by
Roberts Sandra K and Smith Sandra K
Bought by
Smith Iril Lance and Smith Sandra K
Current Estimated Value
Home Financials for this Owner
Home Financials are based on the most recent Mortgage that was taken out on this home.
Original Mortgage
$130,240
Outstanding Balance
$82,639
Interest Rate
5.09%
Mortgage Type
FHA
Estimated Equity
$60,375
Purchase Details
Closed on
Sep 1, 1995
Bought by
Smith Iril L and Smith Sandra K
Create a Home Valuation Report for This Property
The Home Valuation Report is an in-depth analysis detailing your home's value as well as a comparison with similar homes in the area
Home Values in the Area
Average Home Value in this Area
Purchase History
| Date | Buyer | Sale Price | Title Company |
|---|---|---|---|
| Smith Iril Lance | -- | Nations Title Agency Inc | |
| Smith Iril Lance | -- | Nations Title Agency Inc | |
| Smith Iril L | $58,900 | -- |
Source: Public Records
Mortgage History
| Date | Status | Borrower | Loan Amount |
|---|---|---|---|
| Open | Smith Iril Lance | $130,240 | |
| Closed | Smith Iril Lance | $130,240 |
Source: Public Records
Tax History
| Year | Tax Paid | Tax Assessment Tax Assessment Total Assessment is a certain percentage of the fair market value that is determined by local assessors to be the total taxable value of land and additions on the property. | Land | Improvement |
|---|---|---|---|---|
| 2024 | $3,211 | $47,513 | $6,261 | $41,252 |
| 2023 | $2,674 | $39,482 | $6,136 | $33,346 |
| 2022 | $2,349 | $35,544 | $5,524 | $30,020 |
| 2021 | $2,678 | $32,860 | $5,107 | $27,753 |
| 2020 | $2,577 | $31,075 | $4,830 | $26,245 |
| 2019 | $2,653 | $31,604 | $4,838 | $26,766 |
| 2018 | $2,580 | $30,920 | $4,733 | $26,187 |
| 2017 | $2,561 | $30,703 | $4,700 | $26,003 |
| 2016 | $2,524 | $30,051 | $4,600 | $25,451 |
| 2014 | $2,430 | $32,281 | $4,523 | $27,758 |
| 2013 | $3,292 | $32,743 | $4,588 | $28,155 |
Source: Public Records
Map
Nearby Homes
Your Personal Tour Guide
Ask me questions while you tour the home.