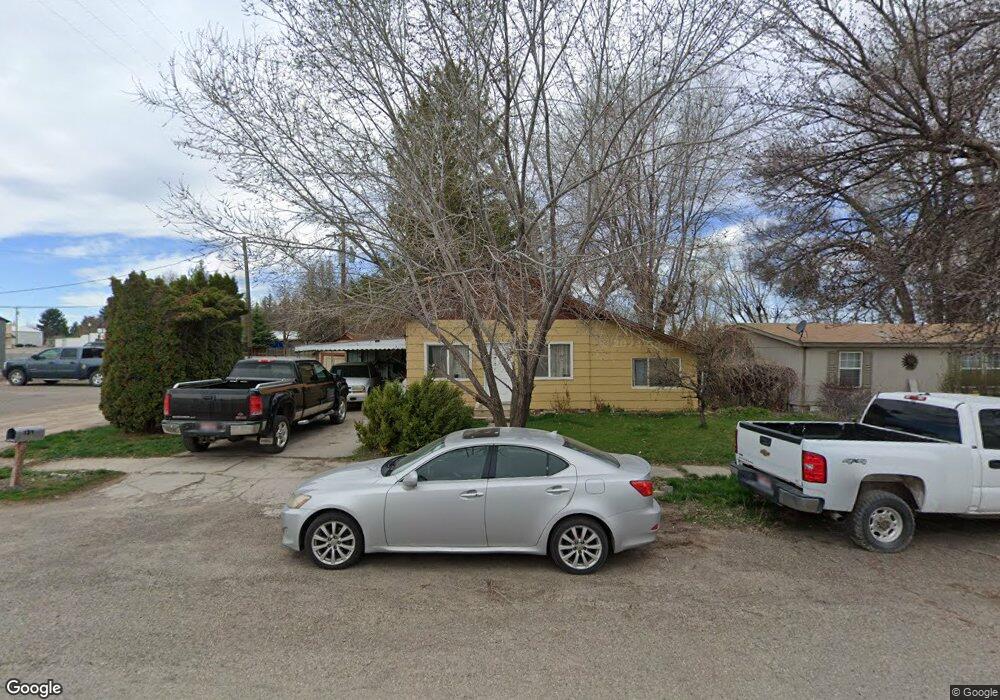
134 N Middleton St Hazelton, ID 83335
Estimated Value: $192,000 - $236,000
--
Bed
--
Bath
966
Sq Ft
$219/Sq Ft
Est. Value
About This Home
This home is located at 134 N Middleton St, Hazelton, ID 83335 and is currently estimated at $211,370, approximately $218 per square foot. 134 N Middleton St is a home with nearby schools including Valley School.
Ownership History
Date
Name
Owned For
Owner Type
Purchase Details
Closed on
May 23, 2008
Sold by
Arteaga Adan A
Bought by
Arteaga Adan A and Arteaga Margarita
Current Estimated Value
Home Financials for this Owner
Home Financials are based on the most recent Mortgage that was taken out on this home.
Original Mortgage
$61,300
Interest Rate
5.87%
Mortgage Type
New Conventional
Purchase Details
Closed on
Nov 13, 2005
Sold by
Arteaga Margarita C
Bought by
Arteaga Adan A
Home Financials for this Owner
Home Financials are based on the most recent Mortgage that was taken out on this home.
Original Mortgage
$58,900
Interest Rate
6.31%
Mortgage Type
FHA
Create a Home Valuation Report for This Property
The Home Valuation Report is an in-depth analysis detailing your home's value as well as a comparison with similar homes in the area
Home Values in the Area
Average Home Value in this Area
Purchase History
| Date | Buyer | Sale Price | Title Company |
|---|---|---|---|
| Arteaga Adan A | -- | First American Title | |
| Arteaga Adan A | -- | None Available |
Source: Public Records
Mortgage History
| Date | Status | Borrower | Loan Amount |
|---|---|---|---|
| Closed | Arteaga Adan A | $61,300 | |
| Closed | Arteaga Adan A | $58,900 |
Source: Public Records
Tax History Compared to Growth
Tax History
| Year | Tax Paid | Tax Assessment Tax Assessment Total Assessment is a certain percentage of the fair market value that is determined by local assessors to be the total taxable value of land and additions on the property. | Land | Improvement |
|---|---|---|---|---|
| 2024 | $868 | $150,185 | $13,845 | $136,340 |
| 2023 | $868 | $150,185 | $13,845 | $136,340 |
| 2022 | $817 | $93,825 | $0 | $0 |
| 2021 | $774 | $76,554 | $9,724 | $66,830 |
| 2020 | $755 | $69,814 | $9,724 | $60,090 |
| 2019 | $739 | $69,814 | $9,724 | $60,090 |
| 2018 | $678 | $46,275 | $9,724 | $36,551 |
| 2016 | $568 | $46,275 | $9,724 | $36,551 |
| 2014 | $553 | $43,864 | $0 | $0 |
Source: Public Records
Map
Nearby Homes