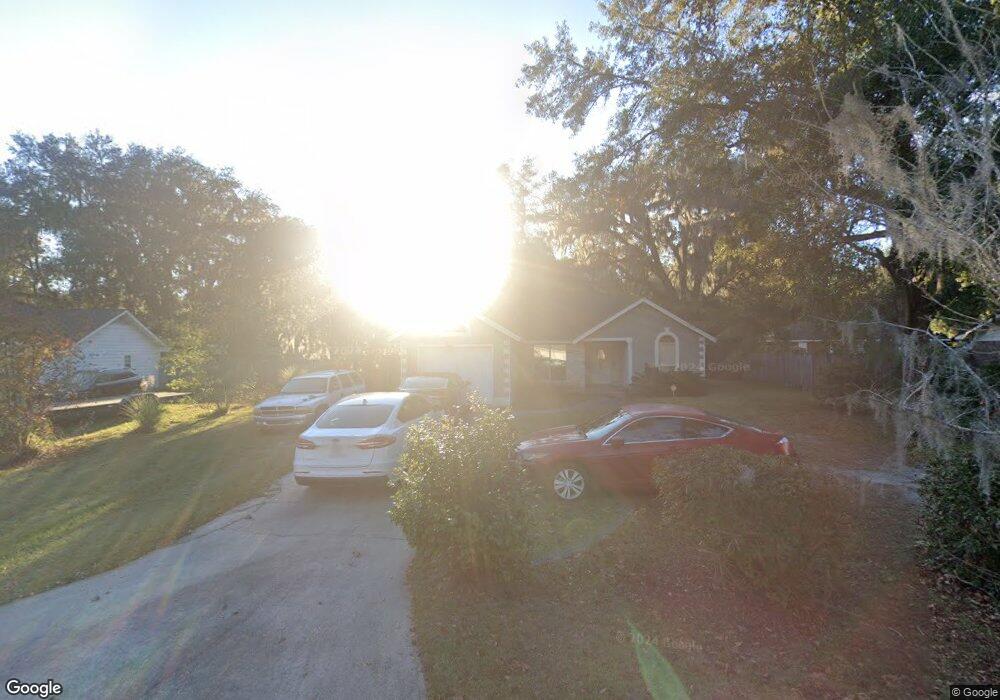
134 Nettles Branch Dr SE Allenhurst, GA 31301
Estimated Value: $189,000 - $211,367
3
Beds
2
Baths
1,344
Sq Ft
$150/Sq Ft
Est. Value
About This Home
This home is located at 134 Nettles Branch Dr SE, Allenhurst, GA 31301 and is currently estimated at $202,092, approximately $150 per square foot. 134 Nettles Branch Dr SE is a home located in Long County with nearby schools including Smiley Elementary School, McClelland Elementary School, and Long County High School.
Ownership History
Date
Name
Owned For
Owner Type
Purchase Details
Closed on
Jan 30, 2012
Bought by
Murphy Arthur
Current Estimated Value
Purchase Details
Closed on
Nov 9, 2011
Sold by
Lopez Hugo L
Bought by
Ever Bank
Purchase Details
Closed on
Nov 1, 2011
Sold by
Everbank
Bought by
Secretary Of Veterans Affairs
Purchase Details
Closed on
Jul 31, 2008
Sold by
Lopez Hugo L
Bought by
Lopez Melissa
Home Financials for this Owner
Home Financials are based on the most recent Mortgage that was taken out on this home.
Original Mortgage
$108,279
Interest Rate
6.31%
Mortgage Type
New Conventional
Purchase Details
Closed on
Oct 2, 1998
Sold by
Peak Gerald D
Bought by
Labranche David E
Purchase Details
Closed on
Jul 12, 1995
Sold by
Iler Craig
Bought by
Brandon C Inc
Purchase Details
Closed on
Sep 13, 1994
Sold by
Iler Craig and Iler Ronald M
Bought by
Iler Craig
Create a Home Valuation Report for This Property
The Home Valuation Report is an in-depth analysis detailing your home's value as well as a comparison with similar homes in the area
Home Values in the Area
Average Home Value in this Area
Purchase History
| Date | Buyer | Sale Price | Title Company |
|---|---|---|---|
| Murphy Arthur | $93,000 | -- | |
| Murphy Arthur | $93,000 | -- | |
| Ever Bank | -- | -- | |
| Secretary Of Veterans Affairs | $90,774 | -- | |
| Everbank | $90,774 | -- | |
| Lopez Melissa | -- | -- | |
| Lopez Hugo L | $106,000 | -- | |
| Labranche David E | $67,000 | -- | |
| Brandon C Inc | -- | -- | |
| Peak Gerald D | $71,100 | -- | |
| Iler Craig | $12,000 | -- |
Source: Public Records
Mortgage History
| Date | Status | Borrower | Loan Amount |
|---|---|---|---|
| Previous Owner | Lopez Hugo L | $108,279 |
Source: Public Records
Tax History Compared to Growth
Tax History
| Year | Tax Paid | Tax Assessment Tax Assessment Total Assessment is a certain percentage of the fair market value that is determined by local assessors to be the total taxable value of land and additions on the property. | Land | Improvement |
|---|---|---|---|---|
| 2024 | $1,840 | $41,484 | $6,000 | $35,484 |
| 2023 | $1,526 | $41,484 | $6,000 | $35,484 |
| 2022 | $1,527 | $41,484 | $6,000 | $35,484 |
| 2021 | $1,501 | $42,613 | $6,000 | $36,613 |
| 2020 | $1,510 | $42,613 | $6,000 | $36,613 |
| 2019 | $1,510 | $42,613 | $6,000 | $36,613 |
| 2018 | $1,511 | $42,613 | $6,000 | $36,613 |
| 2017 | $1,511 | $42,613 | $6,000 | $36,613 |
| 2016 | $1,468 | $42,613 | $6,000 | $36,613 |
| 2015 | -- | $42,613 | $6,000 | $36,613 |
| 2014 | -- | $42,613 | $6,000 | $36,613 |
| 2013 | -- | $42,613 | $6,000 | $36,613 |
Source: Public Records
Map
Nearby Homes
- 151 Hunters Branch Dr
- 1801 Dunlevie Rd
- 40 Red Blossom Ct
- 304 Thompson Rd
- 1343 Talmadge Rd
- 50 Harold's Nook
- 128 Nashview Trail
- 1600 Dunlevie Rd Unit 16
- 1600 Dunlevie Rd Unit 50
- 169 Wellspring Terrace
- 801 Talmadge Rd
- 645 Deer Meadow Way SE
- 555 Deer Meadow Way SE
- 554 Deer Meadow Way SE
- 298 Deer Meadow Way SE
- 575 Deer Meadow Way SE
- 625 Deer Meadow Way SE
- 593 Deer Meadow Way SE
- 266 Antler Ave SE
- 374 Deer Meadow Way SE
- 112 Nettles Branch Dr SE
- 87 Sandy Run Rd SE
- 43 Sandy Run Rd SE
- 150 Nettles Branch Dr SE
- 101 Sandy Run Rd SE
- 100 Nettles Branch Dr SE
- 131 Nettles Branch Dr SE
- 10904 Tibet Hwy SE
- 85 Nettles Branch Dr SE
- 10918 Tibet Hwy SE
- 94 Nettles Branch Dr SE
- 77 Nettles Branch Dr SE
- 10942 Tibet Hwy SE
- 44 Nettles Branch Dr SE
- 65 Nettles Branch Dr SE
- 22 Nettles Branch Dr
- 8 Nettles Branch Dr SE
- 39 Nettles Branch Dr SE
- 30 Bluebird Dr SE
- 9 Nettles Branch Dr SE