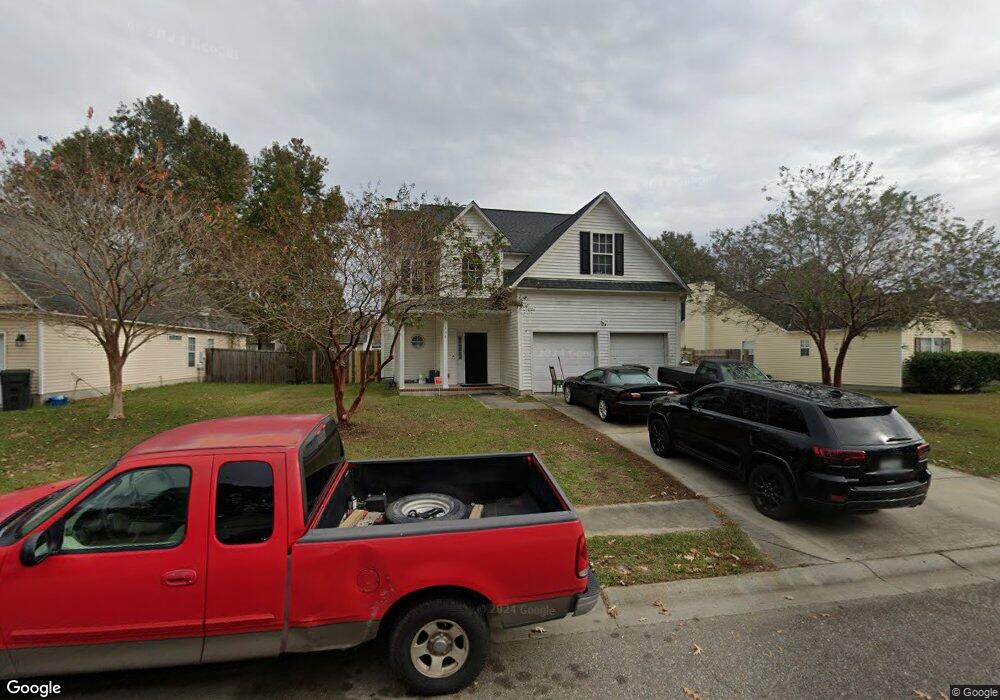
134 Pointer Dr Goose Creek, SC 29445
Estimated Value: $343,000 - $368,000
3
Beds
3
Baths
1,831
Sq Ft
$194/Sq Ft
Est. Value
About This Home
This home is located at 134 Pointer Dr, Goose Creek, SC 29445 and is currently estimated at $355,755, approximately $194 per square foot. 134 Pointer Dr is a home located in Berkeley County with nearby schools including Boulder Bluff Elementary School, Sedgefield Middle School, and Goose Creek High School.
Ownership History
Date
Name
Owned For
Owner Type
Purchase Details
Closed on
Feb 23, 2007
Sold by
Landura Homes Inc
Bought by
Baker Sean P and Baker Jayne N
Current Estimated Value
Home Financials for this Owner
Home Financials are based on the most recent Mortgage that was taken out on this home.
Original Mortgage
$187,900
Outstanding Balance
$112,544
Interest Rate
6.16%
Mortgage Type
Purchase Money Mortgage
Estimated Equity
$243,211
Purchase Details
Closed on
Mar 31, 2006
Sold by
Malphrus Donnie B
Bought by
Anburke Commercial Developers Llc
Purchase Details
Closed on
Jan 25, 2006
Sold by
Anburke Commercial Developers Llc
Bought by
Landura Homes Inc
Home Financials for this Owner
Home Financials are based on the most recent Mortgage that was taken out on this home.
Original Mortgage
$123,000
Interest Rate
6.21%
Mortgage Type
Construction
Purchase Details
Closed on
Nov 24, 2004
Sold by
Malphrus Donnie B
Bought by
Anburke Commercial Developers Llc
Create a Home Valuation Report for This Property
The Home Valuation Report is an in-depth analysis detailing your home's value as well as a comparison with similar homes in the area
Home Values in the Area
Average Home Value in this Area
Purchase History
| Date | Buyer | Sale Price | Title Company |
|---|---|---|---|
| Baker Sean P | $187,900 | None Available | |
| Anburke Commercial Developers Llc | -- | None Available | |
| Landura Homes Inc | $35,000 | None Available | |
| Anburke Commercial Developers Llc | $500,000 | -- |
Source: Public Records
Mortgage History
| Date | Status | Borrower | Loan Amount |
|---|---|---|---|
| Open | Baker Sean P | $187,900 | |
| Previous Owner | Landura Homes Inc | $123,000 |
Source: Public Records
Tax History Compared to Growth
Tax History
| Year | Tax Paid | Tax Assessment Tax Assessment Total Assessment is a certain percentage of the fair market value that is determined by local assessors to be the total taxable value of land and additions on the property. | Land | Improvement |
|---|---|---|---|---|
| 2025 | $1,121 | $192,953 | $31,788 | $161,165 |
| 2024 | $1,097 | $7,719 | $1,272 | $6,447 |
| 2023 | $1,097 | $7,719 | $1,272 | $6,447 |
| 2022 | $1,075 | $6,711 | $1,326 | $5,385 |
| 2021 | $1,157 | $6,720 | $1,326 | $5,385 |
| 2020 | $1,107 | $6,711 | $1,326 | $5,385 |
| 2019 | $1,057 | $6,711 | $1,326 | $5,385 |
| 2018 | $966 | $5,836 | $1,600 | $4,236 |
| 2017 | $959 | $5,836 | $1,600 | $4,236 |
| 2016 | $966 | $5,840 | $1,600 | $4,240 |
| 2015 | $911 | $5,840 | $1,600 | $4,240 |
| 2014 | $857 | $5,840 | $1,600 | $4,240 |
| 2013 | -- | $5,840 | $1,600 | $4,240 |
Source: Public Records
Map
Nearby Homes
- 318 Jean Wells Dr
- 413 Sarah Dr
- 334 Water Oak Dr
- 452 Madeline Dr
- 159 Nello Dr
- 244 Jean Wells Dr
- 405 Madeline Dr
- 235 Mary Scott Dr
- 511 Adalina Dr
- 416 Anita Dr
- 449 Delmont Dr
- 400 Tammie Ave
- 110 Evergreen Magnolia Ave
- 419 Anita Dr
- Lot 32 Boulder Bluff
- Lot 31 Boulder Bluff
- 208 Mary Scott Dr
- 435 Anita Dr
- Lot 30 Boulder Bluff
- Lot 29 Boulder Bluff
- 132 Pointer Dr
- 136 Pointer Dr
- 433 Stephanie Dr
- 130 Pointer Dr
- 435 Stephanie Dr
- 138 Pointer Dr
- 431 Stephanie Dr
- 437 Stephanie Dr
- 135 Pointer Dr
- 137 Pointer Dr
- 133 Pointer Dr
- 128 Pointer Dr
- 131 Pointer Dr
- 140 Pointer Dr
- 439 Stephanie Dr
- 129 Pointer Dr
- 141 Pointer Dr
- 126 Pointer Dr
- 127 Pointer Dr
- 441 Stephanie Dr