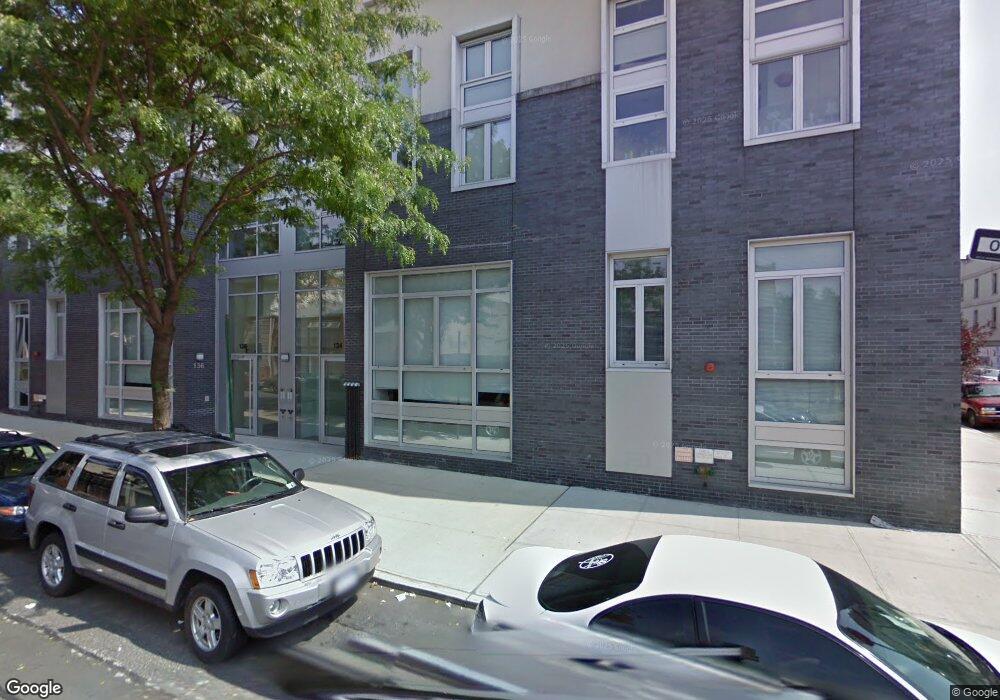
134 Powers St Unit 136 Brooklyn, NY 11211
Williamsburg NeighborhoodEstimated Value: $1,440,000 - $1,519,000
--
Bed
--
Bath
1,018
Sq Ft
$1,448/Sq Ft
Est. Value
About This Home
This home is located at 134 Powers St Unit 136, Brooklyn, NY 11211 and is currently estimated at $1,474,264, approximately $1,448 per square foot. 134 Powers St Unit 136 is a home located in Kings County with nearby schools including P.S. 132 The Conselyea School, Success Academy Charter School-NYC 9, and MESA Charter High School.
Ownership History
Date
Name
Owned For
Owner Type
Purchase Details
Closed on
Jun 10, 2025
Sold by
Angelides Paul and Wasco Emily
Bought by
Chen Michelle S and Chu Albert
Current Estimated Value
Purchase Details
Closed on
Jun 14, 2017
Sold by
Choudhury Alpana and Torpey Michael J
Bought by
Angelides Paul and Wasco Emily
Home Financials for this Owner
Home Financials are based on the most recent Mortgage that was taken out on this home.
Original Mortgage
$832,000
Interest Rate
3.89%
Mortgage Type
Purchase Money Mortgage
Purchase Details
Closed on
Mar 18, 2014
Sold by
Choudhury Alpana and Choudhury Neeruj
Bought by
Choudhury Alpana and Torpey Michael J
Purchase Details
Closed on
Oct 25, 2007
Sold by
252-256 Manhattan Ave Development Llc and % The Tamir Group
Bought by
Choudhury Alpana and Choudhury Neeruj
Home Financials for this Owner
Home Financials are based on the most recent Mortgage that was taken out on this home.
Original Mortgage
$378,950
Interest Rate
6.47%
Mortgage Type
Purchase Money Mortgage
Create a Home Valuation Report for This Property
The Home Valuation Report is an in-depth analysis detailing your home's value as well as a comparison with similar homes in the area
Home Values in the Area
Average Home Value in this Area
Purchase History
| Date | Buyer | Sale Price | Title Company |
|---|---|---|---|
| Chen Michelle S | $1,425,000 | -- | |
| Angelides Paul | $1,040,000 | -- | |
| Angelides Paul | $1,040,000 | -- | |
| Choudhury Alpana | -- | -- | |
| Choudhury Alpana | -- | -- | |
| Choudhury Alpana | $583,000 | -- | |
| Choudhury Alpana | $583,000 | -- |
Source: Public Records
Mortgage History
| Date | Status | Borrower | Loan Amount |
|---|---|---|---|
| Previous Owner | Angelides Paul | $832,000 | |
| Previous Owner | Choudhury Alpana | $378,950 |
Source: Public Records
Tax History Compared to Growth
Tax History
| Year | Tax Paid | Tax Assessment Tax Assessment Total Assessment is a certain percentage of the fair market value that is determined by local assessors to be the total taxable value of land and additions on the property. | Land | Improvement |
|---|---|---|---|---|
| 2025 | $1,610 | $109,656 | $10,355 | $99,301 |
| 2024 | $1,610 | $117,968 | $10,355 | $107,613 |
| 2023 | $1,580 | $117,968 | $10,355 | $107,613 |
| 2022 | $1,576 | $122,828 | $10,355 | $112,473 |
| 2021 | $1,580 | $61,138 | $10,355 | $50,783 |
| 2020 | $777 | $67,102 | $10,355 | $56,747 |
| 2019 | $1,624 | $66,606 | $10,355 | $56,251 |
| 2017 | $1,638 | $46,089 | $10,355 | $35,734 |
| 2016 | $1,660 | $43,079 | $10,356 | $32,723 |
| 2015 | $1,298 | $42,858 | $10,356 | $32,502 |
| 2014 | $1,298 | $42,858 | $10,356 | $32,502 |
Source: Public Records
Map
Nearby Homes
- 245 Manhattan Ave Unit 2-A
- 250 Manhattan Ave Unit 2 R
- 250 Manhattan Ave Unit 4 F
- 136 Powers St Unit 1-G
- 648 Grand St Unit 4B
- 185 Ainslie St Unit 3
- 185 Ainslie St Unit 1
- 185 Ainslie St Unit 2
- 185 Ainslie St Unit PH1
- 738 Grand St Unit 3A
- 107 Devoe St
- 181 Maujer St
- 490 Lorimer St Unit 3 A
- 710 Metropolitan Ave Unit 5-H
- 710 Metropolitan Ave Unit 2-B
- 710 Metropolitan Ave Unit 2-A
- 710 Metropolitan Ave Unit 2-K
- 710 Metropolitan Ave Unit 2-H
- 710 Metropolitan Ave Unit 3-G
- 710 Metropolitan Ave Unit 1-G
- 134 Powers St Unit 1A
- 134 Powers St Unit 136
- 134 Powers St Unit 136
- 134 Powers St Unit 136
- 134 Powers St Unit 136
- 134 Powers St Unit 136
- 134 Powers St Unit 136
- 134 Powers St Unit 136
- 134 Powers St Unit 136
- 134 Powers St Unit 3C136
- 134 Powers St Unit 3B136
- 134 Powers St Unit 3A136
- 134 Powers St Unit 2C136
- 134 Powers St Unit 2B136
- 134 Powers St Unit 2A136
- 134 Powers St Unit 136
- 134 Powers St Unit 1D136
- 134 Powers St Unit 1C136
- 134 Powers St Unit 1B136
- 134 Powers St Unit 1A136