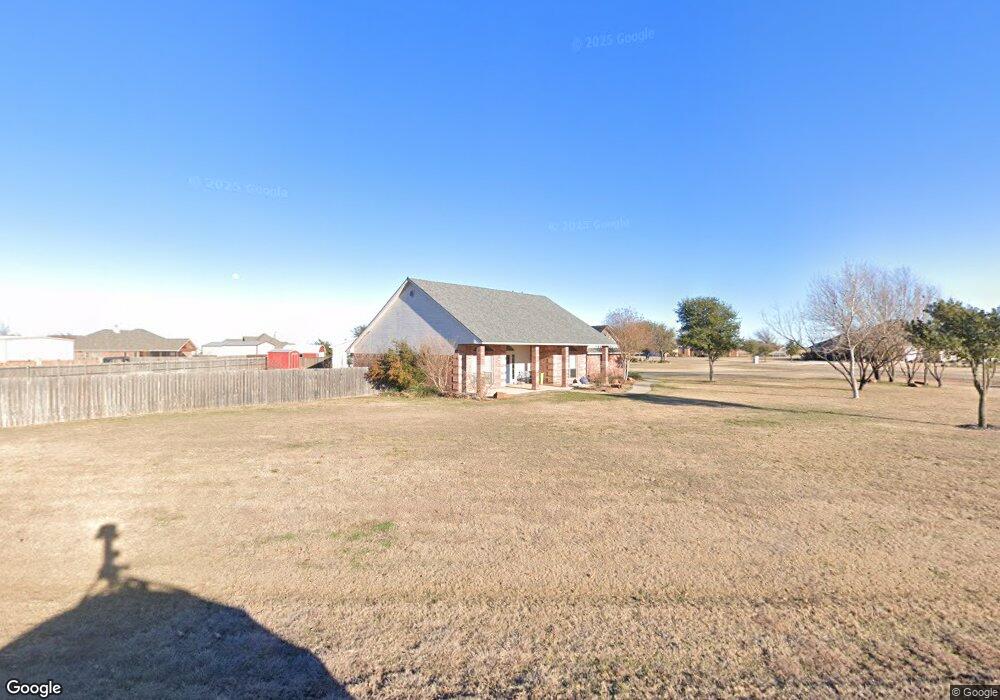
134 Quicksilver Rd Abilene, TX 79602
Estimated Value: $430,000 - $526,000
4
Beds
2
Baths
2,058
Sq Ft
$224/Sq Ft
Est. Value
About This Home
This home is located at 134 Quicksilver Rd, Abilene, TX 79602 and is currently estimated at $460,620, approximately $223 per square foot. 134 Quicksilver Rd is a home located in Taylor County with nearby schools including Wylie West Early Childhood Center, Wylie West Intermediate School, and Wylie West Elementary School.
Ownership History
Date
Name
Owned For
Owner Type
Purchase Details
Closed on
Aug 5, 2020
Sold by
Hough John F and Faulstich Hough Sabrina
Bought by
Gale Peter T and Gale Dawn E
Current Estimated Value
Home Financials for this Owner
Home Financials are based on the most recent Mortgage that was taken out on this home.
Original Mortgage
$185,000
Outstanding Balance
$164,411
Interest Rate
3.1%
Mortgage Type
VA
Estimated Equity
$296,209
Purchase Details
Closed on
Feb 3, 2010
Sold by
Hough Bennedetta Halona
Bought by
Hough John Forrest
Purchase Details
Closed on
Feb 28, 2008
Sold by
New Rudy and New Way Custom Homes
Bought by
Hough John F and Hough Bernedetta H
Home Financials for this Owner
Home Financials are based on the most recent Mortgage that was taken out on this home.
Original Mortgage
$204,197
Interest Rate
5.68%
Mortgage Type
VA
Create a Home Valuation Report for This Property
The Home Valuation Report is an in-depth analysis detailing your home's value as well as a comparison with similar homes in the area
Home Values in the Area
Average Home Value in this Area
Purchase History
| Date | Buyer | Sale Price | Title Company |
|---|---|---|---|
| Gale Peter T | -- | None Available | |
| Hough John Forrest | -- | None Available | |
| Hough John F | -- | None Available |
Source: Public Records
Mortgage History
| Date | Status | Borrower | Loan Amount |
|---|---|---|---|
| Open | Gale Peter T | $185,000 | |
| Previous Owner | Hough John F | $204,197 | |
| Closed | Hough John Forrest | $0 |
Source: Public Records
Tax History Compared to Growth
Tax History
| Year | Tax Paid | Tax Assessment Tax Assessment Total Assessment is a certain percentage of the fair market value that is determined by local assessors to be the total taxable value of land and additions on the property. | Land | Improvement |
|---|---|---|---|---|
| 2025 | $3,088 | $416,928 | -- | -- |
| 2023 | $3,088 | $352,350 | $0 | $0 |
| 2022 | $5,117 | $320,318 | $0 | $0 |
| 2021 | $5,208 | $291,198 | $24,677 | $266,521 |
| 2020 | $4,808 | $262,615 | $24,677 | $237,938 |
| 2019 | $4,919 | $257,298 | $24,677 | $232,621 |
| 2018 | $4,344 | $251,368 | $24,677 | $226,691 |
| 2017 | $3,848 | $231,114 | $24,677 | $206,437 |
| 2016 | $3,646 | $218,966 | $24,677 | $194,289 |
| 2015 | $3,232 | $213,058 | $24,677 | $188,381 |
| 2014 | $3,232 | $207,174 | $0 | $0 |
Source: Public Records
Map
Nearby Homes
- 234 Tweetie Pie Ln
- 249 Quicksilver Rd
- 266 Peach Blossom Dr
- TBD Vinson Road Vinson Rd
- 118 Prairie Creek Way
- 602 Prosperity Rd
- TBD-1 Acre Lot Potos Wolfe Rd
- 1089 Larned Ln
- 109 Merlot Dr
- 109 Periwinkle Trail
- 202 Periwinkle Trail
- Lot 4 Palomino
- Lot 2 Palomino
- Lot 3 250 Palomino
- Lot 1 Palomino
- 132 Blackhawk Rd
- 143 Blackhawk Rd
- 107 Logan Trail
- 110 Logan Trail
- 489 Pollard Rd
- 118 Quicksilver Rd
- 133 Iron Eagle Rd
- 202 Quicksilver Rd
- 133 Quicksilver Rd
- 117 Iron Eagle Rd
- 117 Quicksilver Rd
- 201 Iron Eagle Rd
- 201 Quicksilver Rd
- 102 Quicksilver Rd
- 218 Quicksilver Rd
- 101 Iron Eagle Rd
- 101 Quicksilver Rd
- 134 Iron Eagle Rd
- 134 Tweetie Pie Ln
- 217 Iron Eagle Rd
- 118 Tweetie Pie Ln
- 217 Quicksilver Rd
- 118 Iron Eagle Rd
- 202 Iron Eagle Rd
- 202 Tweetie Pie Ln