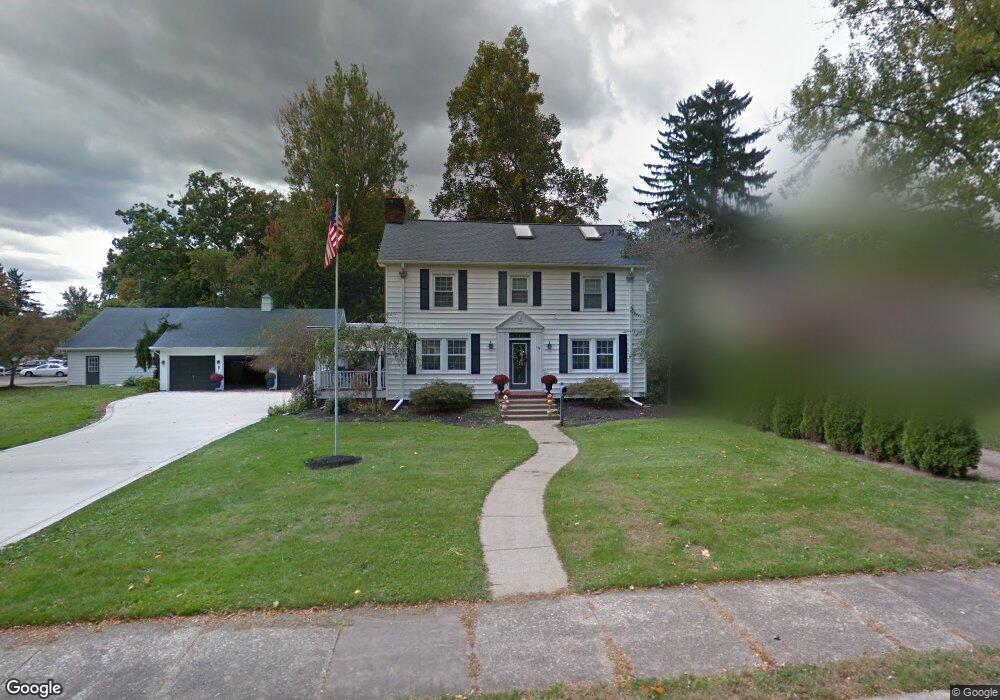
134 S Linwood Ave Norwalk, OH 44857
Estimated Value: $247,000 - $320,000
3
Beds
5
Baths
3,312
Sq Ft
$87/Sq Ft
Est. Value
About This Home
This home is located at 134 S Linwood Ave, Norwalk, OH 44857 and is currently estimated at $286,644, approximately $86 per square foot. 134 S Linwood Ave is a home located in Huron County with nearby schools including Maplehurst Elementary School, Pleasant Elementary School, and League Elementary School.
Ownership History
Date
Name
Owned For
Owner Type
Purchase Details
Closed on
Aug 7, 2020
Sold by
Schmuhl Thomas R and Schmuhl Laura
Bought by
Kalizewski Gary J and Kalizewski Linda J
Current Estimated Value
Purchase Details
Closed on
Nov 2, 2004
Bought by
Schmuhl Thomas R
Purchase Details
Closed on
May 14, 1999
Sold by
Waaland Larry L
Bought by
Garchow Stephen M
Home Financials for this Owner
Home Financials are based on the most recent Mortgage that was taken out on this home.
Original Mortgage
$194,400
Interest Rate
7.04%
Mortgage Type
New Conventional
Purchase Details
Closed on
Jun 13, 1996
Sold by
Gerken Edward J
Bought by
Waaland Larry L and Waaland Denise
Home Financials for this Owner
Home Financials are based on the most recent Mortgage that was taken out on this home.
Original Mortgage
$76,000
Interest Rate
8.05%
Mortgage Type
New Conventional
Purchase Details
Closed on
Mar 22, 1995
Bought by
Gerken Edward J
Create a Home Valuation Report for This Property
The Home Valuation Report is an in-depth analysis detailing your home's value as well as a comparison with similar homes in the area
Home Values in the Area
Average Home Value in this Area
Purchase History
| Date | Buyer | Sale Price | Title Company |
|---|---|---|---|
| Kalizewski Gary J | $290,000 | First American | |
| Schmuhl Thomas R | $247,000 | -- | |
| Garchow Stephen M | $243,000 | -- | |
| Waaland Larry L | $202,000 | -- | |
| Gerken Edward J | -- | -- |
Source: Public Records
Mortgage History
| Date | Status | Borrower | Loan Amount |
|---|---|---|---|
| Previous Owner | Garchow Stephen M | $194,400 | |
| Previous Owner | Waaland Larry L | $76,000 |
Source: Public Records
Tax History Compared to Growth
Tax History
| Year | Tax Paid | Tax Assessment Tax Assessment Total Assessment is a certain percentage of the fair market value that is determined by local assessors to be the total taxable value of land and additions on the property. | Land | Improvement |
|---|---|---|---|---|
| 2024 | $3,404 | $83,380 | $11,680 | $71,700 |
| 2023 | $3,404 | $70,440 | $8,830 | $61,610 |
| 2022 | $2,840 | $70,440 | $8,830 | $61,610 |
| 2021 | $2,842 | $70,440 | $8,830 | $61,610 |
| 2020 | $2,970 | $68,620 | $8,830 | $59,790 |
| 2019 | $2,726 | $65,720 | $5,930 | $59,790 |
| 2018 | $2,678 | $65,720 | $5,930 | $59,790 |
| 2017 | $2,328 | $56,960 | $5,930 | $51,030 |
| 2016 | $2,285 | $56,960 | $5,930 | $51,030 |
| 2015 | $2,284 | $56,960 | $5,930 | $51,030 |
| 2014 | $2,142 | $52,960 | $5,460 | $47,500 |
| 2013 | $1,861 | $52,960 | $5,460 | $47,500 |
Source: Public Records
Map
Nearby Homes
- 134 S Linwood Ave
- 132 S Linwood Ave
- 128 S Linwood Ave
- 167 Benedict Ave
- 165 Benedict Ave
- 126 S Linwood Ave
- 135 S Linwood Ave
- 137 S Linwood Ave
- 281 Us-250
- 12 Forest St
- 163 Benedict Ave
- 131 S Linwood Ave
- 175 Benedict Ave
- 14 Forest St
- 124 S Linwood Ave
- 127 S Linwood Ave
- 16 Forest St
- 159 Benedict Ave
- 159 Benedict Ave
- 120 S Linwood Ave