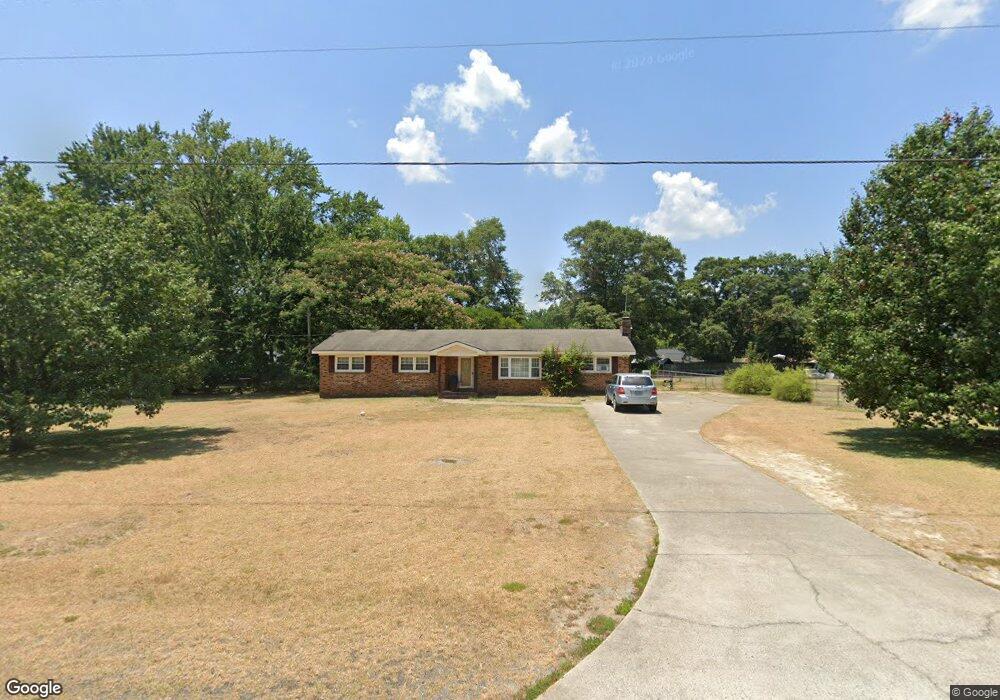
134 Sharon Rd Rockingham, NC 28379
Estimated Value: $137,000 - $210,000
--
Bed
1
Bath
1,311
Sq Ft
$137/Sq Ft
Est. Value
About This Home
This home is located at 134 Sharon Rd, Rockingham, NC 28379 and is currently estimated at $179,434, approximately $136 per square foot. 134 Sharon Rd is a home with nearby schools including Cordova Elementary School, Cordova Middle School, and Ashley Chapel Educational Center.
Ownership History
Date
Name
Owned For
Owner Type
Purchase Details
Closed on
Jun 20, 2022
Sold by
Brooks Thomas William
Bought by
Williams Arthur
Current Estimated Value
Home Financials for this Owner
Home Financials are based on the most recent Mortgage that was taken out on this home.
Original Mortgage
$99,460
Outstanding Balance
$94,637
Interest Rate
5.27%
Mortgage Type
FHA
Estimated Equity
$84,797
Purchase Details
Closed on
Sep 18, 2007
Sold by
Pressley Jerry Dean and Pressley Mia E
Bought by
Brooks Thomas William
Home Financials for this Owner
Home Financials are based on the most recent Mortgage that was taken out on this home.
Original Mortgage
$85,000
Interest Rate
6.62%
Mortgage Type
New Conventional
Purchase Details
Closed on
Mar 22, 2005
Sold by
Smith Kenneth Craig
Bought by
Pressley Jerry D and Pressley Mia E
Home Financials for this Owner
Home Financials are based on the most recent Mortgage that was taken out on this home.
Original Mortgage
$63,750
Interest Rate
9.6%
Mortgage Type
Adjustable Rate Mortgage/ARM
Create a Home Valuation Report for This Property
The Home Valuation Report is an in-depth analysis detailing your home's value as well as a comparison with similar homes in the area
Home Values in the Area
Average Home Value in this Area
Purchase History
| Date | Buyer | Sale Price | Title Company |
|---|---|---|---|
| Williams Arthur | $115,000 | None Listed On Document | |
| Williams Arthur | $115,000 | None Listed On Document | |
| Brooks Thomas William | $85,000 | -- | |
| Pressley Jerry D | -- | -- |
Source: Public Records
Mortgage History
| Date | Status | Borrower | Loan Amount |
|---|---|---|---|
| Open | Williams Arthur | $99,460 | |
| Closed | Williams Arthur | $99,460 | |
| Previous Owner | Brooks Thomas William | $85,000 | |
| Previous Owner | Pressley Jerry D | $63,750 |
Source: Public Records
Tax History Compared to Growth
Tax History
| Year | Tax Paid | Tax Assessment Tax Assessment Total Assessment is a certain percentage of the fair market value that is determined by local assessors to be the total taxable value of land and additions on the property. | Land | Improvement |
|---|---|---|---|---|
| 2025 | $1,191 | $121,769 | $8,771 | $112,998 |
| 2024 | $1,215 | $121,769 | $8,771 | $112,998 |
| 2023 | $1,038 | $92,826 | $7,018 | $85,808 |
| 2022 | $1,038 | $92,826 | $7,018 | $85,808 |
| 2021 | $1,034 | $92,818 | $7,018 | $85,800 |
| 2020 | $1,030 | $92,818 | $7,018 | $85,800 |
| 2019 | $1,030 | $92,818 | $7,018 | $85,800 |
| 2018 | $1,030 | $92,818 | $7,018 | $85,800 |
| 2016 | $989 | $92,818 | $7,018 | $85,800 |
| 2014 | -- | $83,797 | $7,020 | $76,777 |
Source: Public Records
Map
Nearby Homes
- 103 Bluebird Ct
- 192 Rosalyn Rd
- 110 Crown Ct
- TBD Country Canyon Dr
- 126 Winsor Dr
- 177 Westfield Dr
- 552 S Us Highway 1
- 536 Highway 1 S
- 144 Center St
- 0 Old Cheraw Hwy Unit 100531921
- Tbd S US Hwy 1
- 105 1st St
- 449 Us Highway 1 S
- 120 W Eason Dr
- 536 US Highway 1 S
- 350 Lake Rd
- 305 River Rd Unit 3
- 155 Chestnut Ln
- 294 Mizpah Rd
- Tbd Sandhill Rd