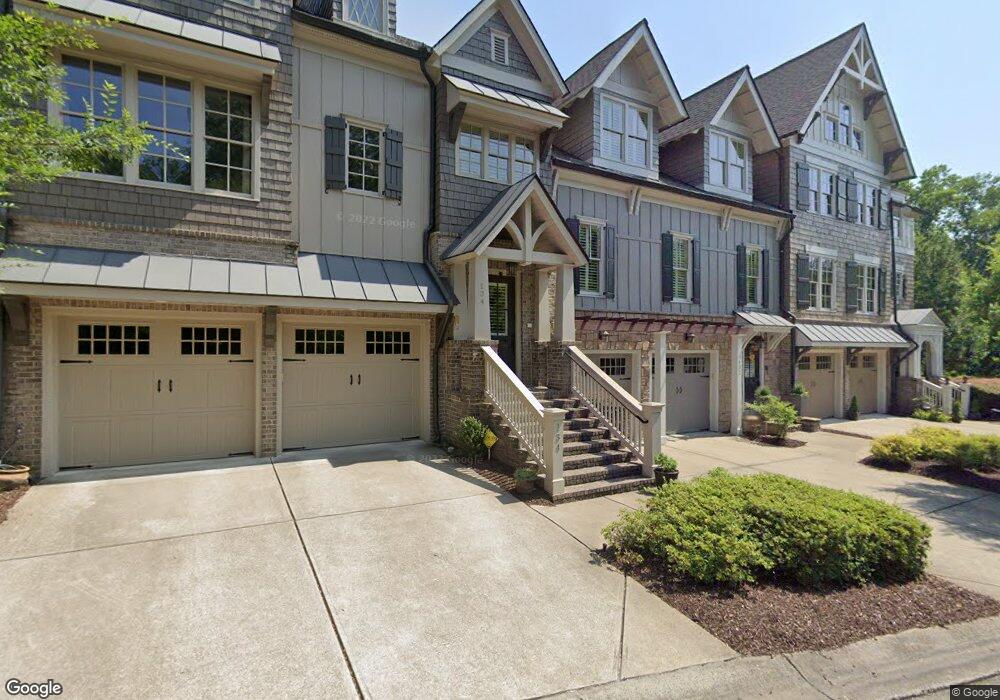
134 Staddlebridge Ave Unit 3 Canton, GA 30114
Sutallee NeighborhoodEstimated Value: $656,983 - $685,000
4
Beds
4
Baths
3,188
Sq Ft
$210/Sq Ft
Est. Value
About This Home
This home is located at 134 Staddlebridge Ave Unit 3, Canton, GA 30114 and is currently estimated at $670,992, approximately $210 per square foot. 134 Staddlebridge Ave Unit 3 is a home located in Cherokee County with nearby schools including Sixes Elementary School, Freedom Middle School, and Woodstock High School.
Ownership History
Date
Name
Owned For
Owner Type
Purchase Details
Closed on
Jun 24, 2025
Sold by
Plunkett Barton P
Bought by
Plunkett Brett Cameron and Sims Erin Nicole
Current Estimated Value
Purchase Details
Closed on
Feb 26, 2016
Sold by
Klutch Brett Joseph
Bought by
Plunkett Barton P and Plunkett Debra A
Purchase Details
Closed on
Mar 21, 2014
Sold by
Whirls Lisa Marie
Bought by
Klutch Brett Joseph and Klutch Tracy P
Home Financials for this Owner
Home Financials are based on the most recent Mortgage that was taken out on this home.
Original Mortgage
$336,775
Interest Rate
3%
Mortgage Type
New Conventional
Purchase Details
Closed on
Jun 15, 2010
Sold by
Province Dev Inc
Bought by
Whirls Lisa M and Jacobs Michael
Home Financials for this Owner
Home Financials are based on the most recent Mortgage that was taken out on this home.
Original Mortgage
$331,070
Interest Rate
4.97%
Mortgage Type
FHA
Create a Home Valuation Report for This Property
The Home Valuation Report is an in-depth analysis detailing your home's value as well as a comparison with similar homes in the area
Home Values in the Area
Average Home Value in this Area
Purchase History
| Date | Buyer | Sale Price | Title Company |
|---|---|---|---|
| Plunkett Brett Cameron | -- | -- | |
| Plunkett Barton P | $380,000 | -- | |
| Klutch Brett Joseph | $354,500 | -- | |
| Whirls Lisa M | $342,500 | -- |
Source: Public Records
Mortgage History
| Date | Status | Borrower | Loan Amount |
|---|---|---|---|
| Previous Owner | Klutch Brett Joseph | $336,775 | |
| Previous Owner | Whirls Lisa M | $331,070 |
Source: Public Records
Tax History Compared to Growth
Tax History
| Year | Tax Paid | Tax Assessment Tax Assessment Total Assessment is a certain percentage of the fair market value that is determined by local assessors to be the total taxable value of land and additions on the property. | Land | Improvement |
|---|---|---|---|---|
| 2025 | $1,463 | $248,272 | $52,000 | $196,272 |
| 2024 | $1,847 | $224,692 | $48,000 | $176,692 |
| 2023 | $1,553 | $226,112 | $44,800 | $181,312 |
| 2022 | $1,520 | $188,048 | $40,000 | $148,048 |
| 2021 | $1,371 | $165,348 | $30,000 | $135,348 |
| 2020 | $4,264 | $152,800 | $30,000 | $122,800 |
| 2019 | $4,102 | $146,560 | $30,000 | $116,560 |
| 2018 | $4,293 | $153,000 | $30,000 | $123,000 |
| 2017 | $4,195 | $369,700 | $30,000 | $117,880 |
| 2016 | $4,365 | $374,800 | $30,000 | $119,920 |
| 2015 | $4,169 | $354,500 | $30,000 | $111,800 |
| 2014 | $3,959 | $357,500 | $28,000 | $115,000 |
Source: Public Records
Map
Nearby Homes
- 132 Staddlebridge Ave
- 217 Trecastle Square
- 265 Trecastle Square
- 221 Trecastle Square
- 302 Trecastle Ln
- 304 Trecastle Ln
- 183 Overlook Ridge Way
- 664 Gold Valley Pass
- 103 Overlook Ridge Way
- 0 Sixes Rd Unit 10648777
- 302 Magnolia Trace
- 226 Heron Pointe View
- 151 Birchwood Pass
- 644 Gold Valley Pass
- 601 Redwood Ln
- 305 Ridge Rd
- 301 Dogwood Heights
- 834 Valley Dr Unit 1K
- 829 Valley Dr
- 444 Pineview Dr
- 134 Staddlebridge Ave
- 134 Staddlebridge Ave Unit .
- 134 Staddlebridge Ave Unit 134
- 132 Staddlebridge Ave Unit 2
- 136 Staddlebridge Ave
- 136 Staddlebridge Ave Unit 4
- 130 Staddlebridge Ave Unit 1
- 130 Staddlebridge Ave Unit 3
- 130 Staddlebridge Ave Unit 130
- 138 Staddlebridge Ave Unit 5
- 138 Staddlebridge Ave
- 140 Staddlebridge Ave
- 142 Staddlebridge Ave
- 142 Staddlebridge Ave Unit 7
- 139 Staddlebridge Ave Unit 139
- 139 Staddlebridge Ave
- 139 Staddlebridge Ave Unit 85
- 141 Staddlebridge Ave Unit 84
- 141 Staddlebridge Ave
- 146 Staddlebridge Ave