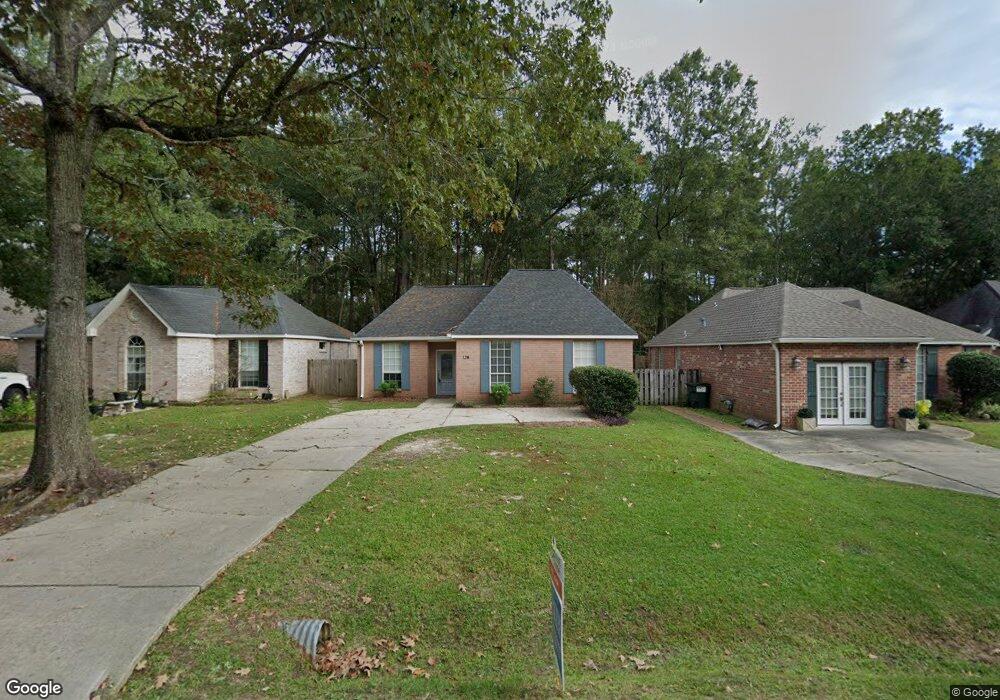
134 Trace Loop Mandeville, LA 70448
Estimated Value: $254,022 - $265,000
3
Beds
2
Baths
1,435
Sq Ft
$181/Sq Ft
Est. Value
About This Home
This home is located at 134 Trace Loop, Mandeville, LA 70448 and is currently estimated at $259,756, approximately $181 per square foot. 134 Trace Loop is a home located in St. Tammany Parish with nearby schools including Woodlake Elementary School, Mandeville Middle School, and Fontainebleau Junior High School.
Ownership History
Date
Name
Owned For
Owner Type
Purchase Details
Closed on
Dec 29, 2022
Sold by
Foster Karl Gene and Foster Anne Caroline
Bought by
Itnyre Trust and Itnyre
Current Estimated Value
Purchase Details
Closed on
Jan 8, 2018
Sold by
Baudier Joseph Ralph
Bought by
Foster Karl Gene and Foster Anne Caroline Fruehauf
Purchase Details
Closed on
Apr 26, 2011
Sold by
Nichols Kuhns Jessica D and Kuhns Benjamin J
Bought by
Baudier Joseph Ralph
Home Financials for this Owner
Home Financials are based on the most recent Mortgage that was taken out on this home.
Original Mortgage
$168,547
Interest Rate
4.87%
Mortgage Type
VA
Purchase Details
Closed on
Feb 12, 2010
Sold by
Perschall Kathleen Mclaughlin and Perschall Desmond F
Bought by
Kuhns Benjamin J and Nichols Jessica D
Home Financials for this Owner
Home Financials are based on the most recent Mortgage that was taken out on this home.
Original Mortgage
$144,000
Interest Rate
5.11%
Mortgage Type
New Conventional
Create a Home Valuation Report for This Property
The Home Valuation Report is an in-depth analysis detailing your home's value as well as a comparison with similar homes in the area
Home Values in the Area
Average Home Value in this Area
Purchase History
| Date | Buyer | Sale Price | Title Company |
|---|---|---|---|
| Itnyre Trust | $250,000 | Crescent Title | |
| Foster Karl Gene | $175,000 | Crescent Title | |
| Baudier Joseph Ralph | $165,000 | Elite Title Insurance Agency | |
| Kuhns Benjamin J | $160,000 | Winters Title Agency Inc |
Source: Public Records
Mortgage History
| Date | Status | Borrower | Loan Amount |
|---|---|---|---|
| Previous Owner | Baudier Joseph Ralph | $168,547 | |
| Previous Owner | Kuhns Benjamin J | $144,000 |
Source: Public Records
Tax History
| Year | Tax Paid | Tax Assessment Tax Assessment Total Assessment is a certain percentage of the fair market value that is determined by local assessors to be the total taxable value of land and additions on the property. | Land | Improvement |
|---|---|---|---|---|
| 2025 | $2,213 | $18,446 | $2,500 | $15,946 |
| 2024 | $2,213 | $18,446 | $2,500 | $15,946 |
| 2023 | $2,294 | $17,201 | $2,500 | $14,701 |
| 2022 | $227,999 | $17,201 | $2,500 | $14,701 |
| 2021 | $2,276 | $17,201 | $2,500 | $14,701 |
| 2020 | $2,273 | $17,201 | $2,500 | $14,701 |
| 2019 | $2,225 | $16,229 | $2,500 | $13,729 |
| 2018 | $2,228 | $16,229 | $2,500 | $13,729 |
| 2017 | $2,249 | $16,229 | $2,500 | $13,729 |
| 2016 | $2,267 | $16,229 | $2,500 | $13,729 |
| 2015 | $1,064 | $14,913 | $2,500 | $12,413 |
| 2014 | $1,053 | $14,913 | $2,500 | $12,413 |
| 2013 | -- | $14,913 | $2,500 | $12,413 |
Source: Public Records
Map
Nearby Homes
- 134 Trace Loop
- 140 Trace Loop
- 140 Trace Loop Other
- 140 Trace Loop None
- 130 Trace Loop
- 144 Trace Loop
- 102 Trace Loop Unit 104
- 188 Trace Loop Unit 188
- 180 Trace Loop
- 104 Trace Loop Unit 100
- 182 Trace Loop
- 172 Trace Loop
- 176 Trace Loop
- 176 Trace Loop
- 176 Trace Loop
- 182 Trace Loop
- 184 Trace Loop
- 172 Trace Loop
- 102 Trace Loop
- 104 Trace Loop
Your Personal Tour Guide
Ask me questions while you tour the home.