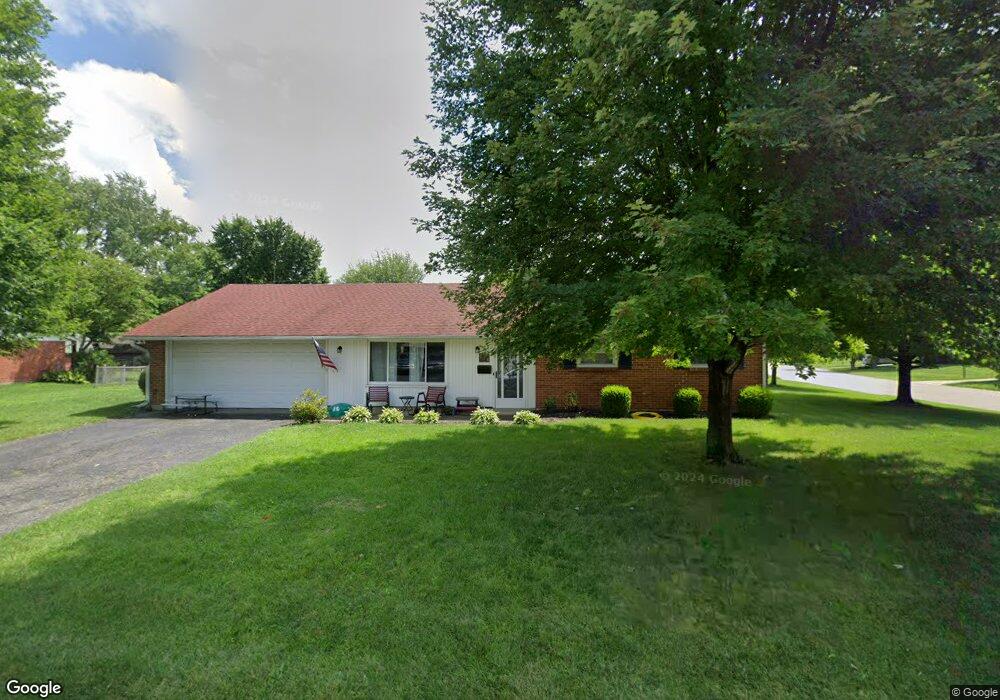
134 Tuxworth Rd Dayton, OH 45458
Estimated Value: $256,000 - $300,000
3
Beds
2
Baths
1,330
Sq Ft
$210/Sq Ft
Est. Value
About This Home
This home is located at 134 Tuxworth Rd, Dayton, OH 45458 and is currently estimated at $278,941, approximately $209 per square foot. 134 Tuxworth Rd is a home located in Montgomery County with nearby schools including Primary Village South, Cline Elementary, and Tower Heights Middle School.
Ownership History
Date
Name
Owned For
Owner Type
Purchase Details
Closed on
Mar 30, 2018
Sold by
Jainco Ii Llc
Bought by
Mays Timmy
Current Estimated Value
Home Financials for this Owner
Home Financials are based on the most recent Mortgage that was taken out on this home.
Original Mortgage
$145,960
Interest Rate
5.5%
Mortgage Type
FHA
Purchase Details
Closed on
Jul 22, 2014
Sold by
James Timothy
Bought by
Jainco Ii Llc
Purchase Details
Closed on
Apr 8, 2013
Sold by
Fannie Mae
Bought by
James Timothy
Purchase Details
Closed on
Nov 6, 2012
Sold by
Farrell Charles R
Bought by
Reverse Mortgage Solutions Inc
Purchase Details
Closed on
Sep 11, 2012
Sold by
Reverse Mortgage Solutions Inc
Bought by
Fannie Mae and Federal National Mortgage Association
Create a Home Valuation Report for This Property
The Home Valuation Report is an in-depth analysis detailing your home's value as well as a comparison with similar homes in the area
Home Values in the Area
Average Home Value in this Area
Purchase History
| Date | Buyer | Sale Price | Title Company |
|---|---|---|---|
| Mays Timmy | $151,000 | Vantage Land Title | |
| Mays Timmy | $151,000 | Vantage Land Title | |
| Jainco Ii Llc | $113,000 | Triad Title Agency Inc | |
| James Timothy | $88,000 | Prism Title & Closing Servic | |
| Reverse Mortgage Solutions Inc | -- | None Available | |
| Fannie Mae | $119,000 | None Available |
Source: Public Records
Mortgage History
| Date | Status | Borrower | Loan Amount |
|---|---|---|---|
| Previous Owner | Mays Timmy | $145,960 |
Source: Public Records
Tax History Compared to Growth
Tax History
| Year | Tax Paid | Tax Assessment Tax Assessment Total Assessment is a certain percentage of the fair market value that is determined by local assessors to be the total taxable value of land and additions on the property. | Land | Improvement |
|---|---|---|---|---|
| 2024 | $4,149 | $71,360 | $14,390 | $56,970 |
| 2023 | $4,149 | $71,360 | $14,390 | $56,970 |
| 2022 | $3,822 | $52,120 | $10,500 | $41,620 |
| 2021 | $3,832 | $52,120 | $10,500 | $41,620 |
| 2020 | $3,827 | $52,120 | $10,500 | $41,620 |
| 2019 | $3,713 | $45,120 | $10,500 | $34,620 |
| 2018 | $3,372 | $45,120 | $10,500 | $34,620 |
| 2017 | $3,336 | $45,120 | $10,500 | $34,620 |
| 2016 | $3,342 | $42,660 | $10,500 | $32,160 |
| 2015 | $3,226 | $42,660 | $10,500 | $32,160 |
| 2014 | $3,226 | $42,660 | $10,500 | $32,160 |
| 2012 | -- | $41,640 | $10,500 | $31,140 |
Source: Public Records
Map
Nearby Homes
- 170 S Main St Unit C
- 435 Clareridge Ln
- 35 Bywood Ct
- 51 Winchester (#E) Place
- 92 E Ridgeway Dr
- 694 Spring Ridge Place
- 40 Cemetery Dr
- 156 Mallard Glen Dr Unit 4
- 8977 Slagle Rd
- 121 Woodfield Place
- 140 Mallard Glen Dr Unit 3
- 553 E Spring Valley Pike
- 843 Clareridge Ln Unit 843
- 155 Bristol Dr
- 325 Annette Dr
- 306 Monarch Rd
- 61 Lynn Rae Cir
- 1071 Star Valley Ct
- 284 Tauber Dr
- 296 Tauber Dr
- 253 Bellingham Dr
- 135 Tuxworth Rd
- 124 Tuxworth Rd
- 145 Tuxworth Rd
- 154 Tuxworth Rd
- 145 Cloverwood Dr
- 165 Cloverwood Dr
- 254 Bellingham Dr
- 175 Cloverwood Dr
- 244 Martha Ave
- 165 Tuxworth Rd
- 233 Martha Ave
- 264 Bellingham Dr
- 185 Cloverwood Dr
- 114 Tuxworth Rd
- 164 Tuxworth Rd
- 3 Martha Ave
- 115 Tuxworth Rd
- 234 Martha Ave
- 185 Tuxworth Rd