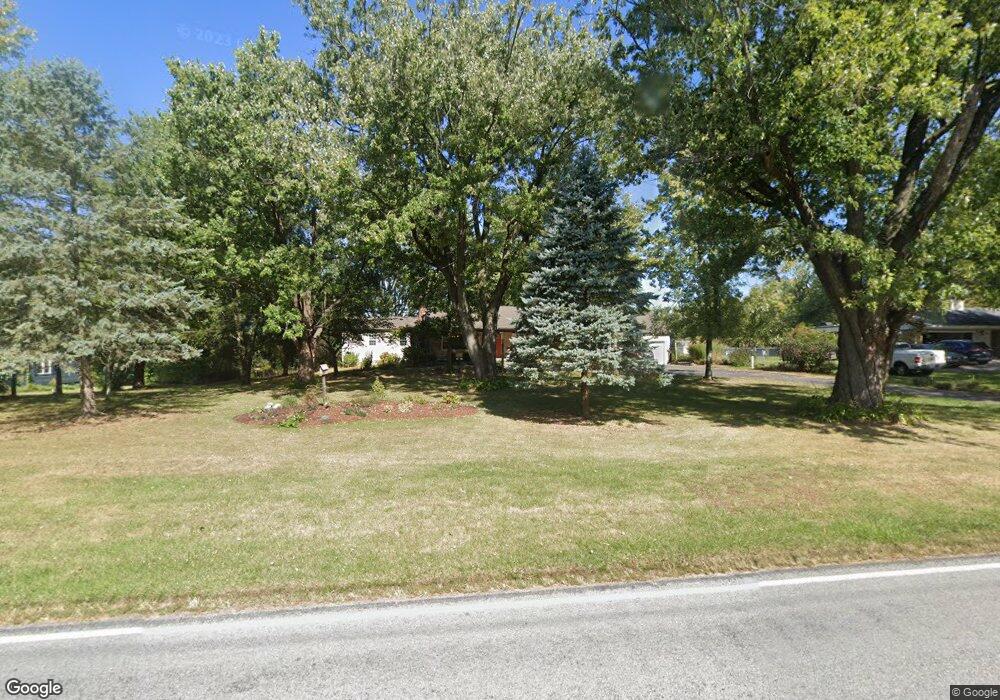
134 W Possum Rd Springfield, OH 45506
Estimated Value: $300,864 - $328,000
3
Beds
2
Baths
1,924
Sq Ft
$164/Sq Ft
Est. Value
About This Home
This home is located at 134 W Possum Rd, Springfield, OH 45506 and is currently estimated at $314,716, approximately $163 per square foot. 134 W Possum Rd is a home located in Clark County with nearby schools including Possum Elementary School, Shawnee Middle School/High School, and Risen Christ Lutheran School.
Ownership History
Date
Name
Owned For
Owner Type
Purchase Details
Closed on
Jun 28, 2007
Sold by
Ammons Christine R
Bought by
Roberge Laurie R
Current Estimated Value
Home Financials for this Owner
Home Financials are based on the most recent Mortgage that was taken out on this home.
Original Mortgage
$201,400
Outstanding Balance
$122,507
Interest Rate
6.26%
Mortgage Type
Purchase Money Mortgage
Estimated Equity
$192,209
Purchase Details
Closed on
Dec 3, 2004
Sold by
Davis Stephen C
Bought by
Ammons Christine R
Home Financials for this Owner
Home Financials are based on the most recent Mortgage that was taken out on this home.
Original Mortgage
$159,000
Interest Rate
5.82%
Mortgage Type
Purchase Money Mortgage
Purchase Details
Closed on
Nov 14, 1995
Sold by
Burnett Thomas E
Bought by
Ammons Stephen C Davis and Ammons Christine R
Home Financials for this Owner
Home Financials are based on the most recent Mortgage that was taken out on this home.
Original Mortgage
$86,850
Interest Rate
7.7%
Mortgage Type
New Conventional
Create a Home Valuation Report for This Property
The Home Valuation Report is an in-depth analysis detailing your home's value as well as a comparison with similar homes in the area
Home Values in the Area
Average Home Value in this Area
Purchase History
| Date | Buyer | Sale Price | Title Company |
|---|---|---|---|
| Roberge Laurie R | $212,000 | Attorney | |
| Ammons Christine R | -- | -- | |
| Ammons Stephen C Davis | $96,500 | -- |
Source: Public Records
Mortgage History
| Date | Status | Borrower | Loan Amount |
|---|---|---|---|
| Open | Roberge Laurie R | $201,400 | |
| Previous Owner | Ammons Christine R | $159,000 | |
| Previous Owner | Ammons Stephen C Davis | $86,850 |
Source: Public Records
Tax History
| Year | Tax Paid | Tax Assessment Tax Assessment Total Assessment is a certain percentage of the fair market value that is determined by local assessors to be the total taxable value of land and additions on the property. | Land | Improvement |
|---|---|---|---|---|
| 2025 | $3,739 | $99,630 | $24,460 | $75,170 |
| 2024 | $3,642 | $74,390 | $17,740 | $56,650 |
| 2023 | $3,642 | $74,390 | $17,740 | $56,650 |
| 2022 | $3,613 | $74,390 | $17,740 | $56,650 |
| 2021 | $3,148 | $58,000 | $13,440 | $44,560 |
| 2020 | $3,174 | $58,000 | $13,440 | $44,560 |
| 2019 | $3,224 | $58,000 | $13,440 | $44,560 |
| 2018 | $2,977 | $52,830 | $16,310 | $36,520 |
| 2017 | $3,051 | $50,866 | $16,307 | $34,559 |
| 2016 | $2,753 | $50,866 | $16,307 | $34,559 |
| 2015 | $2,647 | $49,277 | $15,680 | $33,597 |
| 2014 | $2,655 | $49,277 | $15,680 | $33,597 |
| 2013 | $2,307 | $49,277 | $15,680 | $33,597 |
Source: Public Records
Map
Nearby Homes
- 2801 S Springfield Jamestown St
- 703 Dorchester Dr
- 201 Kinnane Ave
- 402 Highview Ave
- 505 Highview Ave
- 533 Highview Ave
- 2642 Springfield Xenia Rd
- 711 Kinnane Ave
- 414 W Sparrow Rd
- 2252 Ontario Ave
- 1448 W Sparrow Rd
- 204 Bassett Dr
- 2301 Duquesne Dr
- 1421 Seminole Ave
- 2170 Fairfield Pike
- 2140 Shawnee Ave
- 1730 Damascus Ave
- 2000 Springmont Ave
- 518 Hazelbrook Ave
- 1823 Clay St
- 132 W Possum Rd
- 140 W Possum Rd
- 146 W Possum Rd
- 130 W Possum Rd
- 135 W Possum Rd
- 125 W Possum Rd
- 155 W Possum Rd
- 74 W Possum Rd
- 145 W Possum Rd
- 121 W Possum Rd
- 160 W Possum Rd
- 161 W Possum Rd
- 115 W Possum Rd
- 72 W Possum Rd
- 165 W Possum Rd
- 170 W Possum Rd
- 70 W Possum Rd
- 111 W Possum Rd
- 175 W Possum Rd
- 180 W Possum Rd
Your Personal Tour Guide
Ask me questions while you tour the home.