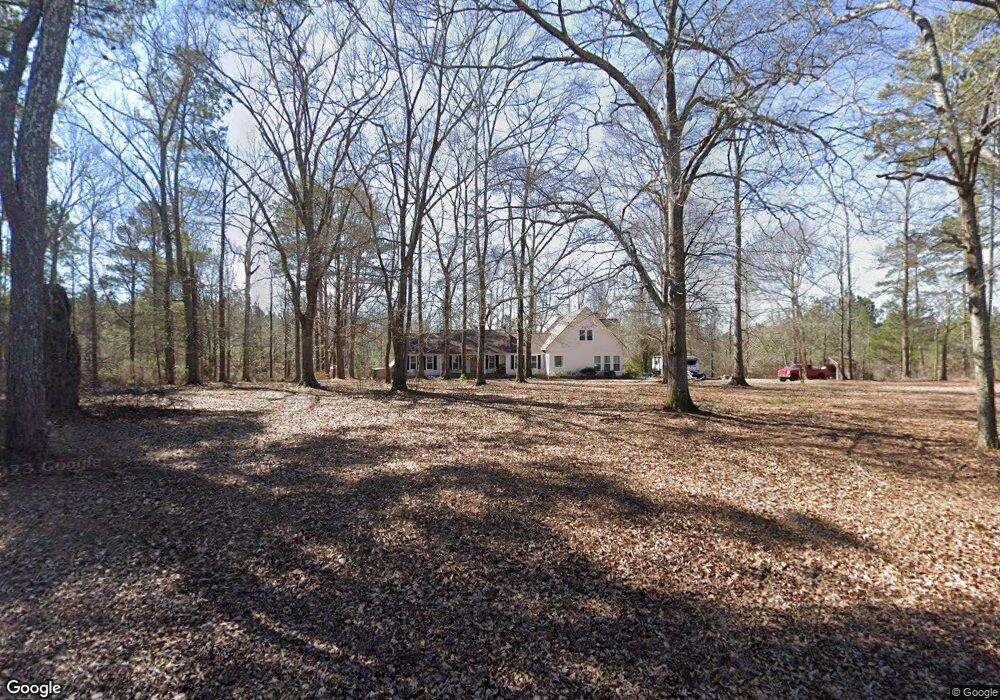
1340 Durden Rd Rutledge, GA 30663
Estimated Value: $546,998 - $810,000
5
Beds
4
Baths
3,550
Sq Ft
$182/Sq Ft
Est. Value
About This Home
This home is located at 1340 Durden Rd, Rutledge, GA 30663 and is currently estimated at $647,250, approximately $182 per square foot. 1340 Durden Rd is a home located in Morgan County with nearby schools including Morgan County Primary School, Morgan County Elementary School, and Morgan County Middle School.
Ownership History
Date
Name
Owned For
Owner Type
Purchase Details
Closed on
Jun 1, 2021
Sold by
Dunn Jennifer M
Bought by
Little Caleb and Little Kerrin
Current Estimated Value
Home Financials for this Owner
Home Financials are based on the most recent Mortgage that was taken out on this home.
Original Mortgage
$316,000
Outstanding Balance
$284,222
Interest Rate
2.9%
Mortgage Type
New Conventional
Estimated Equity
$363,028
Purchase Details
Closed on
Dec 24, 2003
Sold by
Samuels Jennifer M
Bought by
Dunn Jennifer M
Purchase Details
Closed on
Apr 20, 2001
Sold by
Samuels Roy E
Bought by
Samuels Jennifer M
Purchase Details
Closed on
Feb 28, 1990
Sold by
Holt George I
Bought by
Samuels Roy E
Create a Home Valuation Report for This Property
The Home Valuation Report is an in-depth analysis detailing your home's value as well as a comparison with similar homes in the area
Home Values in the Area
Average Home Value in this Area
Purchase History
| Date | Buyer | Sale Price | Title Company |
|---|---|---|---|
| Little Caleb | $395,000 | -- | |
| Dunn Jennifer M | -- | -- | |
| Samuels Jennifer M | -- | -- | |
| Samuels Roy E | $10,100 | -- |
Source: Public Records
Mortgage History
| Date | Status | Borrower | Loan Amount |
|---|---|---|---|
| Open | Little Caleb | $316,000 |
Source: Public Records
Tax History
| Year | Tax Paid | Tax Assessment Tax Assessment Total Assessment is a certain percentage of the fair market value that is determined by local assessors to be the total taxable value of land and additions on the property. | Land | Improvement |
|---|---|---|---|---|
| 2025 | $4,301 | $226,982 | $41,447 | $185,535 |
| 2024 | $4,372 | $193,893 | $37,302 | $156,591 |
| 2023 | $4,045 | $174,119 | $33,158 | $140,961 |
| 2022 | $3,816 | $158,461 | $24,868 | $133,593 |
| 2021 | $2,616 | $108,514 | $19,060 | $89,454 |
| 2020 | $2,640 | $108,514 | $19,060 | $89,454 |
| 2019 | $2,683 | $108,514 | $19,060 | $89,454 |
| 2018 | $2,692 | $107,301 | $17,847 | $89,454 |
| 2017 | $2,776 | $107,141 | $17,847 | $89,294 |
| 2016 | $2,518 | $97,188 | $17,327 | $79,861 |
| 2015 | $2,627 | $100,020 | $16,440 | $83,580 |
| 2014 | $2,192 | $86,076 | $15,960 | $70,116 |
| 2013 | -- | $62,140 | $18,160 | $43,980 |
Source: Public Records
Map
Nearby Homes
- 0 Dickson Rd Unit 70092
- 0 Dickson Rd Unit 10568585
- 2190 Reese Rd
- 3320 Davis Academy Rd
- 2470 Fears Rd
- 0 Fears Rd Unit 10647993
- 0 Fears Rd Unit 7684722
- 0 Fears Rd Unit 26394214
- 0 Fears Rd Unit CL344239
- 0 Fears Rd Unit 69810
- 0 Fears Rd Unit 10647985
- 3641 Davis Academy Rd
- 3195 Davis Academy Rd
- 0 Fears Rd Unit 10569285
- 00 Fears Rd
- 00 Fears Rd
- 0 Newborn Rd Unit 70044
- 1760 Fears Rd
- 3011 Clack Rd
- 206 N Johnson St
- 1321 Durden Rd Unit 50
- 1321 Durden Rd
- 1210 Durden Rd
- 1401 Durden Rd
- 1380 Durden Rd
- 1380 Durden Rd
- 1351 Durden Rd
- 1100 Durden Rd
- 1430 Durden Rd
- 1540 Durden Rd
- 1090 Durden Rd
- 1101 Durden Rd
- 1081 Reese Ln
- 1491 Durden Rd
- 1051 Reese Ln
- 1541 Durden Rd
- 1061 Durden Rd
- 1560 Durden Rd
- 2201 Reese Rd
- 1080 Reese Ln
Your Personal Tour Guide
Ask me questions while you tour the home.