


1340 E 1100 S Unit Fairmount Fairmount, IN 46928
Estimated payment $225/month
1
Acre
$38,000
Price per Acre
43,560
Sq Ft Lot
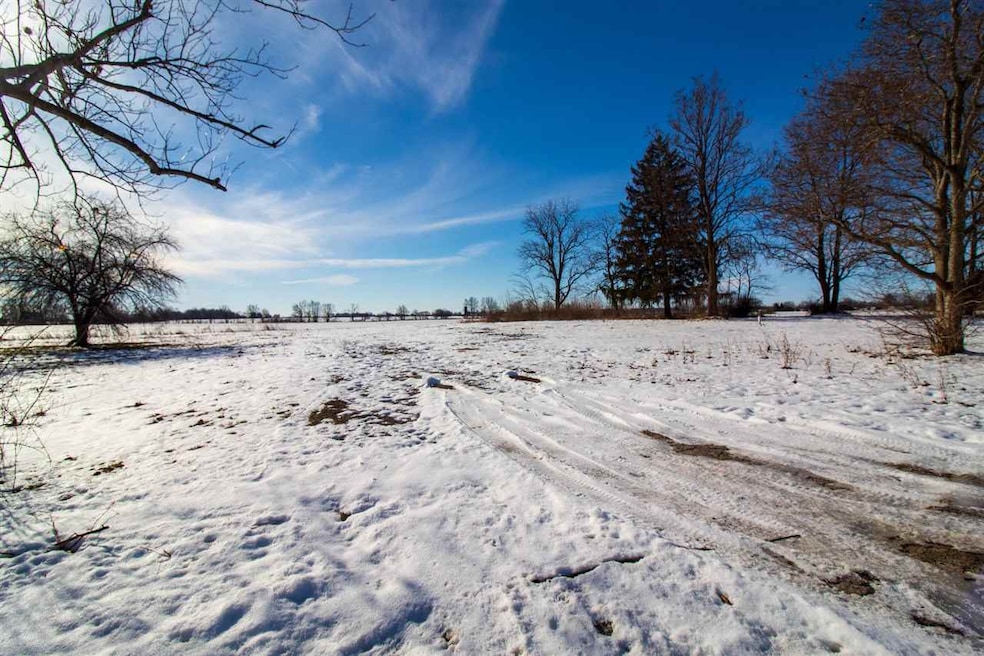
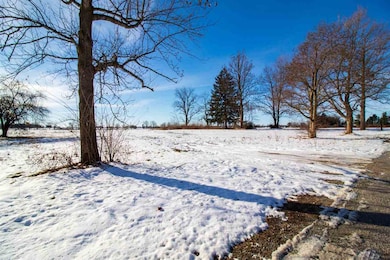
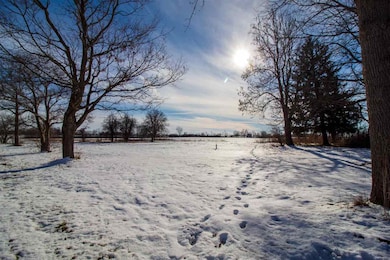
About This Lot
Escape to the quiet countryside with this serene 1-acre parcel tucked away among mature trees. Enjoy the charm of your own persimmon tree and the convenience of a gravel driveway, sturdy concrete slab and established well. Electricity and septic tile are available onsite, giving you a great jumpstart toward building your dream retreat.

Property Details
Property Type
- Land
Lot Details
- 1 Acre Lot
- Lot Dimensions are 215x205
Utilities
- Propane
- Well
- Sewer Not Available
Map
Create a Home Valuation Report for This Property
The Home Valuation Report is an in-depth analysis detailing your home's value as well as a comparison with similar homes in the area
Home Values in the Area
Average Home Value in this Area
Tax History
| Year | Tax Paid | Tax Assessment Tax Assessment Total Assessment is a certain percentage of the fair market value that is determined by local assessors to be the total taxable value of land and additions on the property. | Land | Improvement |
|---|---|---|---|---|
| 2024 | $316 | $28,300 | $22,700 | $5,600 |
| 2023 | $781 | $70,500 | $22,700 | $47,800 |
| 2022 | $781 | $64,500 | $22,700 | $41,800 |
| 2021 | $722 | $55,900 | $20,700 | $35,200 |
| 2020 | $611 | $54,800 | $20,700 | $34,100 |
| 2019 | $751 | $67,600 | $20,700 | $46,900 |
| 2018 | $190 | $62,600 | $17,300 | $45,300 |
| 2017 | $167 | $63,200 | $17,300 | $45,900 |
| 2016 | $156 | $60,300 | $16,400 | $43,900 |
| 2014 | $146 | $59,600 | $16,400 | $43,200 |
| 2013 | $146 | $59,400 | $16,400 | $43,000 |
Source: Public Records
Property History
| Date | Event | Price | List to Sale | Price per Sq Ft |
|---|---|---|---|---|
| 12/10/2025 12/10/25 | For Sale | $38,000 | -- | -- |
Source: Richmond Association of REALTORS®
Purchase History
| Date | Type | Sale Price | Title Company |
|---|---|---|---|
| Quit Claim Deed | $12,000 | None Listed On Document |
Source: Public Records
Source: Richmond Association of REALTORS®
MLS Number: 10052536
APN: 27-15-05-200-003.000-034
Nearby Homes
- 1340 E 1100 S
- 1260 E 1050 S
- 104 E Harrison St
- 407 S Penn St
- 115 S Walnut St
- 323 E First St
- 10580 S 300 E
- 705 E Third St
- 220 E 950 S
- 220 E 950 S Unit Fairmount
- 502 Seward Ln
- 560 E 900 S
- 1316 N Factory St
- 1421 N Elm St
- 1780 E 1700 N
- 1780 E 1700 N Unit Summitville
- 0 E 1050 S
- 305 N 7th St
- 812 E Walnut St
- 501 E Walnut St
- 223 E Second St Unit 3
- 7145 S Meridian St
- 231 E South C St
- 215 N Harrisburg Ave Unit 6
- 5000 Prestwick Square
- 4224 S Washington St Unit 4224 1E
- 412 N Lincoln Ave
- 411 N Sheridan St Unit .5
- 3722 S Granton Place Dr
- 605 W Jefferson St
- 3406 S Overman Ave
- 751 Catalina Dr
- 701 S Black St
- 2824 S Boots St
- 2448 Jefferson Cir
- 2410 M
- 903 W 11th St
- 816 S Boots St
- 816 S Boots St
- 3744 Jonathan Ridge