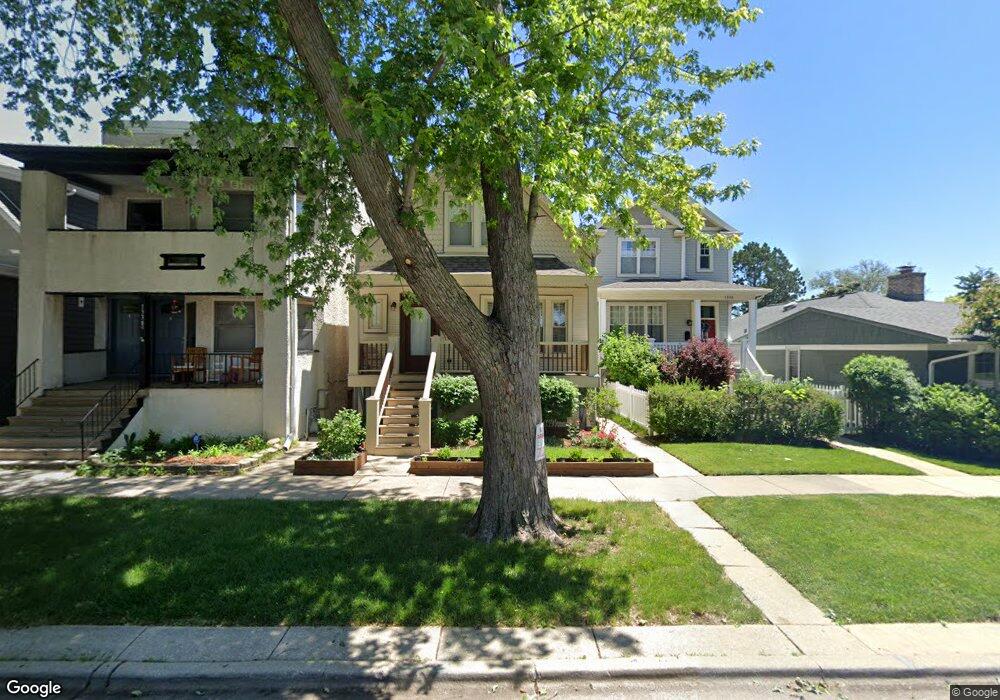
1340 Marengo Ave Forest Park, IL 60130
Estimated Value: $421,352 - $461,000
4
Beds
3
Baths
1,455
Sq Ft
$305/Sq Ft
Est. Value
About This Home
This home is located at 1340 Marengo Ave, Forest Park, IL 60130 and is currently estimated at $443,088, approximately $304 per square foot. 1340 Marengo Ave is a home located in Cook County with nearby schools including Garfield Elementary School, Betsy Ross Elementary School, and Field Stevenson Elementary School.
Ownership History
Date
Name
Owned For
Owner Type
Purchase Details
Closed on
Mar 31, 2006
Sold by
Bogard James R
Bought by
Davis Scott and Ryan Jacqueline
Current Estimated Value
Home Financials for this Owner
Home Financials are based on the most recent Mortgage that was taken out on this home.
Original Mortgage
$347,200
Outstanding Balance
$200,903
Interest Rate
6.48%
Mortgage Type
Fannie Mae Freddie Mac
Estimated Equity
$242,185
Purchase Details
Closed on
Nov 30, 2004
Sold by
Rdbl Llc
Bought by
Bogard James R
Home Financials for this Owner
Home Financials are based on the most recent Mortgage that was taken out on this home.
Original Mortgage
$236,000
Interest Rate
5%
Mortgage Type
Unknown
Purchase Details
Closed on
Sep 24, 2004
Sold by
Cole Taylor Bank
Bought by
Rdbl Llc
Create a Home Valuation Report for This Property
The Home Valuation Report is an in-depth analysis detailing your home's value as well as a comparison with similar homes in the area
Home Values in the Area
Average Home Value in this Area
Purchase History
| Date | Buyer | Sale Price | Title Company |
|---|---|---|---|
| Davis Scott | $434,500 | First American Title Ins Co | |
| Bogard James R | $295,000 | Prairie Title | |
| Rdbl Llc | $215,000 | Prairie Title |
Source: Public Records
Mortgage History
| Date | Status | Borrower | Loan Amount |
|---|---|---|---|
| Open | Davis Scott | $347,200 | |
| Previous Owner | Bogard James R | $236,000 |
Source: Public Records
Tax History Compared to Growth
Tax History
| Year | Tax Paid | Tax Assessment Tax Assessment Total Assessment is a certain percentage of the fair market value that is determined by local assessors to be the total taxable value of land and additions on the property. | Land | Improvement |
|---|---|---|---|---|
| 2024 | $8,326 | $31,035 | $2,344 | $28,691 |
| 2023 | $8,449 | $31,035 | $2,344 | $28,691 |
| 2022 | $8,449 | $26,995 | $1,797 | $25,198 |
| 2021 | $8,056 | $26,993 | $1,796 | $25,197 |
| 2020 | $7,926 | $26,993 | $1,796 | $25,197 |
| 2019 | $8,355 | $27,157 | $1,640 | $25,517 |
| 2018 | $8,180 | $27,157 | $1,640 | $25,517 |
| 2017 | $8,853 | $29,625 | $1,640 | $27,985 |
| 2016 | $6,820 | $21,529 | $1,484 | $20,045 |
| 2015 | $7,773 | $24,659 | $1,484 | $23,175 |
| 2014 | $7,645 | $24,659 | $1,484 | $23,175 |
| 2013 | $7,516 | $25,870 | $1,484 | $24,386 |
Source: Public Records
Map
Nearby Homes
- 1327 Harlem Ave
- 1409 Harlem Ave
- 1434 Circle Ave
- 1223 Elgin Ave Unit G1
- 1224 Elgin Ave
- 1225 Marengo Ave
- 1227 S Harlem Ave Unit 512
- 1227 S Harlem Ave Unit 208
- 1227 S Harlem Ave Unit 307
- 1227 S Harlem Ave Unit 514
- 1227 S Harlem Ave Unit 510
- 1227 S Harlem Ave Unit 415
- 1309 Maple Ave
- 1329 Wisconsin Ave
- 1216 Wenonah Ave
- 1101 Harlem Ave Unit 203
- 1103 Circle Ave
- 1118 Thomas Ave
- 1042 Circle Ave
- 1617 Maple Ave
- 1342 Marengo Ave
- 1338 Marengo Ave
- 1336 Marengo Ave
- 7245 14th St
- 7245 14th St
- 1343 Elgin Ave
- 1339 Elgin Ave
- 1345 Elgin Ave
- 1345 Elgin Ave
- 1337 Elgin Ave
- 1330 Marengo Ave
- 1330 Marengo Ave
- 1335 Elgin Ave
- 1333 Elgin Ave
- 1326 Marengo Ave
- 1400 Marengo Ave
- 1331 Elgin Ave
- 1341 Marengo Ave
- 1335 Marengo Ave Unit 2
- 1335 Marengo Ave Unit 1