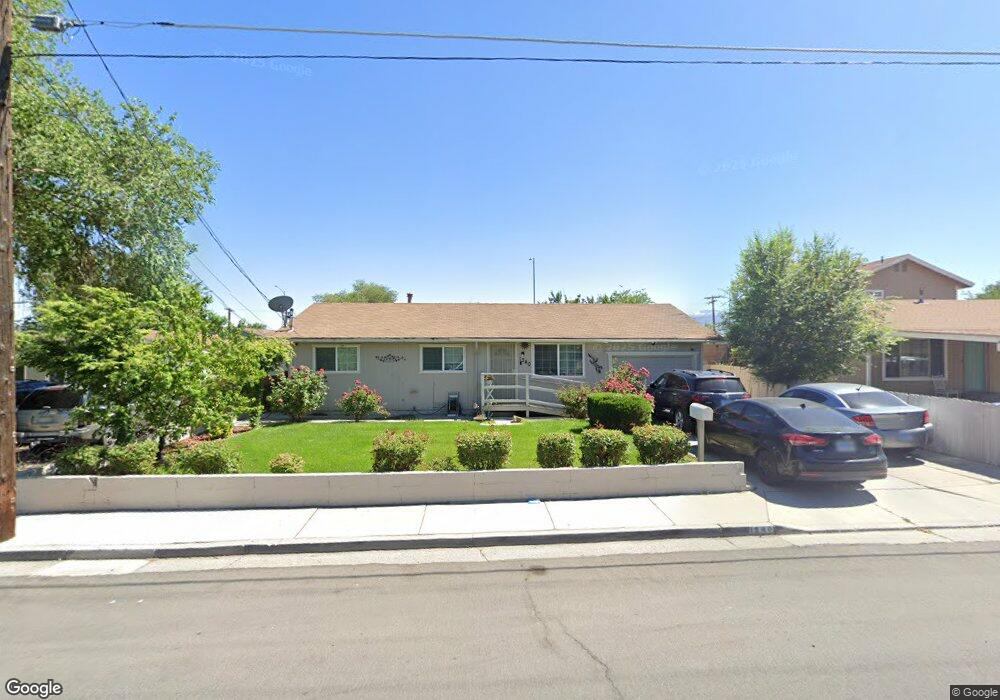
1340 Oliver St Reno, NV 89512
Northeast Reno NeighborhoodEstimated Value: $361,286 - $376,000
3
Beds
2
Baths
1,008
Sq Ft
$366/Sq Ft
Est. Value
About This Home
This home is located at 1340 Oliver St, Reno, NV 89512 and is currently estimated at $368,572, approximately $365 per square foot. 1340 Oliver St is a home located in Washoe County with nearby schools including Rita Cannan Elementary School, Fred W. Traner Middle School, and Procter R. Hug High School.
Ownership History
Date
Name
Owned For
Owner Type
Purchase Details
Closed on
Nov 1, 2018
Sold by
Heibronn Lori
Bought by
1340 Oliver Llc
Current Estimated Value
Purchase Details
Closed on
Apr 30, 2015
Sold by
Reno Project Management Llc
Bought by
Heilbronn Lori
Home Financials for this Owner
Home Financials are based on the most recent Mortgage that was taken out on this home.
Original Mortgage
$139,650
Interest Rate
3.64%
Mortgage Type
New Conventional
Purchase Details
Closed on
Sep 18, 2014
Sold by
Perez Ramon and Perez Reyna
Bought by
Reno Project Management Llc
Purchase Details
Closed on
Aug 23, 2006
Sold by
Perez Ramon and Perez Reyna
Bought by
Perez Ramon and Perez Reyna
Home Financials for this Owner
Home Financials are based on the most recent Mortgage that was taken out on this home.
Original Mortgage
$135,000
Interest Rate
8.75%
Mortgage Type
Unknown
Create a Home Valuation Report for This Property
The Home Valuation Report is an in-depth analysis detailing your home's value as well as a comparison with similar homes in the area
Home Values in the Area
Average Home Value in this Area
Purchase History
| Date | Buyer | Sale Price | Title Company |
|---|---|---|---|
| 1340 Oliver Llc | $244,500 | Western Title Co | |
| Heilbronn Lori | $147,000 | Western Title Co | |
| Reno Project Management Llc | $94,000 | Western Title Company Inc | |
| Perez Ramon | -- | First American Title |
Source: Public Records
Mortgage History
| Date | Status | Borrower | Loan Amount |
|---|---|---|---|
| Previous Owner | Heilbronn Lori | $139,650 | |
| Previous Owner | Perez Ramon | $135,000 |
Source: Public Records
Tax History Compared to Growth
Tax History
| Year | Tax Paid | Tax Assessment Tax Assessment Total Assessment is a certain percentage of the fair market value that is determined by local assessors to be the total taxable value of land and additions on the property. | Land | Improvement |
|---|---|---|---|---|
| 2025 | $1,162 | $44,371 | $25,641 | $18,730 |
| 2024 | $1,162 | $42,125 | $22,712 | $19,413 |
| 2023 | $1,042 | $42,672 | $24,917 | $17,755 |
| 2022 | $966 | $34,860 | $19,719 | $15,141 |
| 2021 | $895 | $28,856 | $13,451 | $15,405 |
| 2020 | $839 | $28,443 | $12,726 | $15,717 |
| 2019 | $798 | $28,259 | $12,695 | $15,564 |
| 2018 | $762 | $24,177 | $8,678 | $15,499 |
| 2017 | $740 | $23,330 | $7,515 | $15,815 |
| 2016 | $722 | $23,166 | $6,717 | $16,449 |
| 2015 | $684 | $19,773 | $4,622 | $15,151 |
| 2014 | $662 | $18,521 | $3,791 | $14,730 |
| 2013 | -- | $17,215 | $2,489 | $14,726 |
Source: Public Records
Map
Nearby Homes
- 1895 Citron St
- 1680 Sutro St
- 1868 Fife Dr
- 1925 Citron St
- 1525 Carville Dr
- 1955 Wilder St
- 1855 Mccloud Ave
- 1885 Castle Way
- 2424 Sutro St
- 1990 Trainer Way
- 1775 Carville Dr
- 1365 E 11th St
- 1347 Butler St
- 2085 Highview Ct Unit 2
- 2090 Highview Ct Unit 7
- 2065 Wedekind Rd
- 1281 E 10th St
- 2355 Tripp Dr Unit 7
- 2101 Highview Ct Unit 9
- 2375 Tripp Dr Unit 11
- 1340 Oliver Ave
- 1330 Oliver St
- 1350 Oliver St
- 1320 Oliver St
- 1360 Oliver St
- 1360 Oliver Ave
- 1335 Oliver St
- 1355 Oliver Ave
- 1300 Oliver Ave
- 1370 Oliver St
- 1300 Oliver St
- 1370 Oliver Ave
- 1355 Oliver St
- 1313 Oliver St
- 1815 Bishop St
- 1415 Trainer Way
- 1401 Trainer Way
- 1385 Trainer Way
- 1820 Bishop St
- 1435 Trainer Way