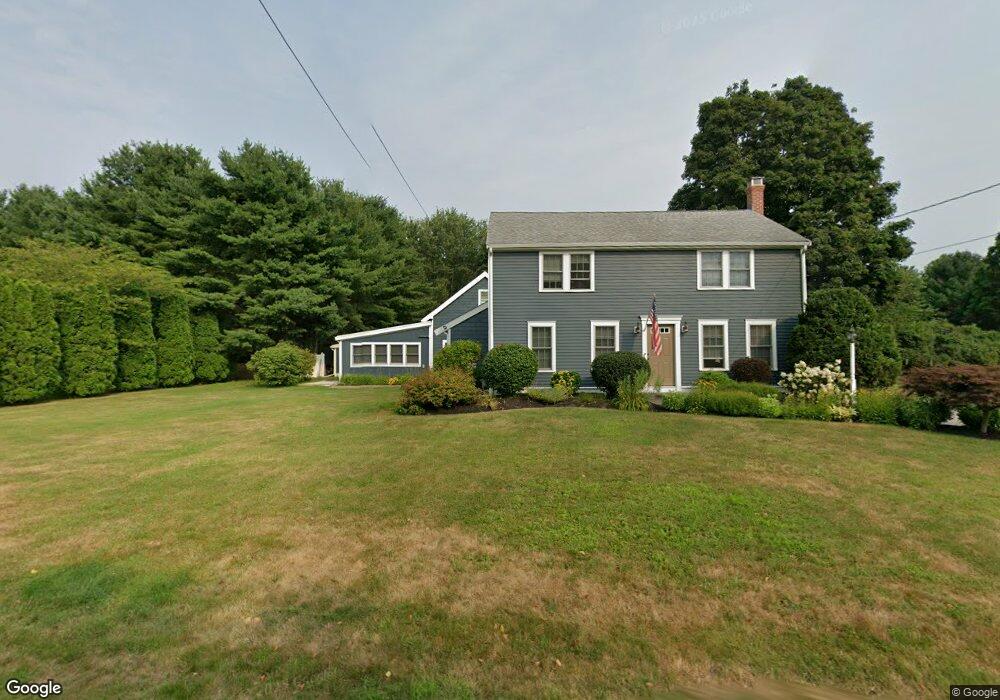
1340 West St Mansfield, MA 02048
Estimated Value: $753,885 - $841,000
3
Beds
3
Baths
2,485
Sq Ft
$324/Sq Ft
Est. Value
About This Home
This home is located at 1340 West St, Mansfield, MA 02048 and is currently estimated at $806,221, approximately $324 per square foot. 1340 West St is a home located in Bristol County with nearby schools including Everett W. Robinson Elementary School, Jordan/Jackson Elementary School, and Harold L. Qualters Middle School.
Ownership History
Date
Name
Owned For
Owner Type
Purchase Details
Closed on
Dec 7, 2018
Sold by
Sankey Todd A
Bought by
Sankey Laura
Current Estimated Value
Purchase Details
Closed on
Apr 29, 2011
Sold by
Sankey Todd A and Sankey Nancy L
Bought by
Sankey Todd A
Purchase Details
Closed on
Jan 29, 1999
Sold by
Johnstone David C and Hickey Karen M
Bought by
Sankey Todd A and Sankey Tammy L
Create a Home Valuation Report for This Property
The Home Valuation Report is an in-depth analysis detailing your home's value as well as a comparison with similar homes in the area
Home Values in the Area
Average Home Value in this Area
Purchase History
| Date | Buyer | Sale Price | Title Company |
|---|---|---|---|
| Sankey Laura | -- | -- | |
| Sankey Todd A | -- | -- | |
| Sankey Todd A | -- | -- | |
| Sankey Todd A | $163,900 | -- |
Source: Public Records
Mortgage History
| Date | Status | Borrower | Loan Amount |
|---|---|---|---|
| Previous Owner | Sankey Todd A | $290,405 | |
| Previous Owner | Sankey Todd A | $206,250 | |
| Previous Owner | Sankey Todd A | $15,000 |
Source: Public Records
Tax History Compared to Growth
Tax History
| Year | Tax Paid | Tax Assessment Tax Assessment Total Assessment is a certain percentage of the fair market value that is determined by local assessors to be the total taxable value of land and additions on the property. | Land | Improvement |
|---|---|---|---|---|
| 2025 | $8,478 | $643,700 | $253,500 | $390,200 |
| 2024 | $7,088 | $525,000 | $253,500 | $271,500 |
| 2023 | $6,511 | $462,100 | $253,500 | $208,600 |
| 2022 | $6,282 | $414,100 | $234,800 | $179,300 |
| 2021 | $6,513 | $424,000 | $205,400 | $218,600 |
| 2020 | $5,884 | $383,100 | $195,600 | $187,500 |
| 2019 | $6,121 | $402,200 | $162,900 | $239,300 |
| 2018 | $5,701 | $415,600 | $155,500 | $260,100 |
| 2017 | $5,491 | $365,600 | $151,200 | $214,400 |
| 2016 | $5,071 | $329,100 | $143,700 | $185,400 |
| 2015 | $5,101 | $329,100 | $143,700 | $185,400 |
Source: Public Records
Map
Nearby Homes