1340 Whippoorwill Ln Unit 1340 Mansfield, OH 44906
Estimated Value: $240,000 - $270,000
2
Beds
2
Baths
1,318
Sq Ft
$191/Sq Ft
Est. Value
About This Home
This home is located at 1340 Whippoorwill Ln Unit 1340, Mansfield, OH 44906 and is currently estimated at $251,971, approximately $191 per square foot. 1340 Whippoorwill Ln Unit 1340 is a home located in Richland County with nearby schools including Mansfield Christian School, Discovery School, and Mansfield Seventh-day Adventist School.
Ownership History
Date
Name
Owned For
Owner Type
Purchase Details
Closed on
Aug 15, 2011
Sold by
Hughes Gloria A
Bought by
Enright Donald L and Enright Patricia A
Current Estimated Value
Purchase Details
Closed on
Jul 6, 2006
Sold by
The Richland Trust Co
Bought by
Hughes Gloria A
Home Financials for this Owner
Home Financials are based on the most recent Mortgage that was taken out on this home.
Original Mortgage
$104,000
Outstanding Balance
$61,845
Interest Rate
6.68%
Mortgage Type
Purchase Money Mortgage
Estimated Equity
$190,126
Purchase Details
Closed on
Feb 24, 2000
Sold by
Step Stone Ltd Llc
Bought by
Morris Thomas E
Home Financials for this Owner
Home Financials are based on the most recent Mortgage that was taken out on this home.
Original Mortgage
$116,900
Interest Rate
8.13%
Mortgage Type
New Conventional
Create a Home Valuation Report for This Property
The Home Valuation Report is an in-depth analysis detailing your home's value as well as a comparison with similar homes in the area
Home Values in the Area
Average Home Value in this Area
Purchase History
| Date | Buyer | Sale Price | Title Company |
|---|---|---|---|
| Enright Donald L | $108,900 | Chicago Title | |
| Hughes Gloria A | $130,000 | Southern Title | |
| Morris Thomas E | $129,900 | -- |
Source: Public Records
Mortgage History
| Date | Status | Borrower | Loan Amount |
|---|---|---|---|
| Open | Hughes Gloria A | $104,000 | |
| Previous Owner | Morris Thomas E | $116,900 |
Source: Public Records
Tax History Compared to Growth
Tax History
| Year | Tax Paid | Tax Assessment Tax Assessment Total Assessment is a certain percentage of the fair market value that is determined by local assessors to be the total taxable value of land and additions on the property. | Land | Improvement |
|---|---|---|---|---|
| 2024 | $2,240 | $57,630 | $6,270 | $51,360 |
| 2023 | $2,240 | $57,630 | $6,270 | $51,360 |
| 2022 | $1,958 | $43,780 | $5,290 | $38,490 |
| 2021 | $1,971 | $43,780 | $5,290 | $38,490 |
| 2020 | $2,016 | $43,780 | $5,290 | $38,490 |
| 2019 | $1,812 | $37,160 | $4,480 | $32,680 |
| 2018 | $1,787 | $37,160 | $4,480 | $32,680 |
| 2017 | $1,739 | $37,160 | $4,480 | $32,680 |
| 2016 | $1,715 | $35,920 | $7,850 | $28,070 |
| 2015 | $1,638 | $35,920 | $7,850 | $28,070 |
| 2014 | $36 | $35,920 | $7,850 | $28,070 |
| 2012 | $1,489 | $35,920 | $7,850 | $28,070 |
Source: Public Records
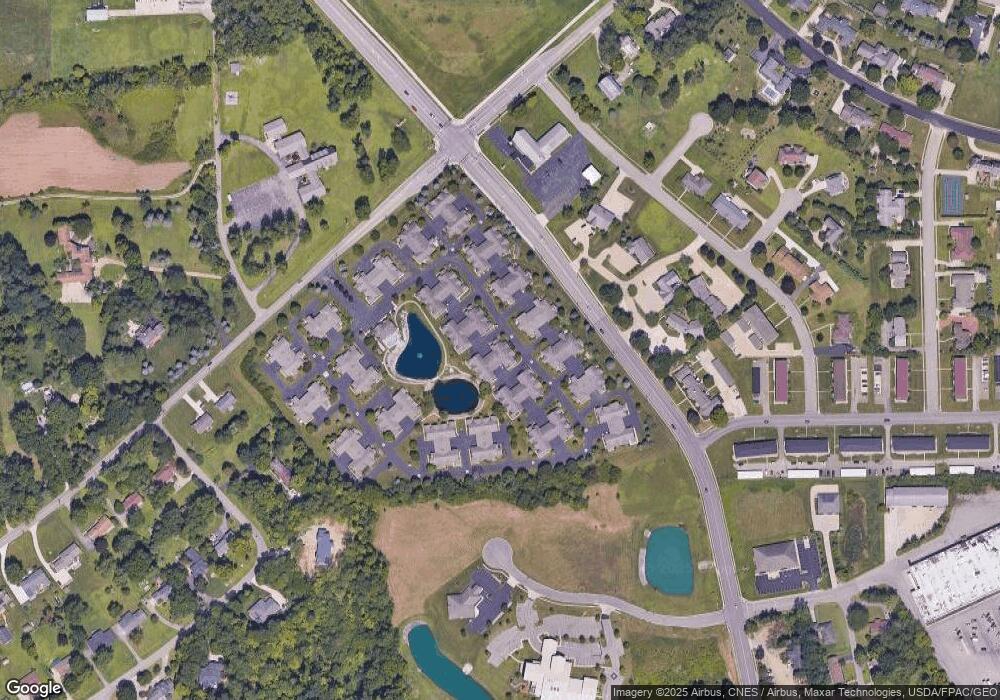
Map
Nearby Homes
- 240 Whippoorwill Ln Unit 240
- 1163 Woodland Rd
- 1201 W Cook Rd
- 654 Courtwright Blvd
- 0 U S Highway 42
- 1332 Springbrook Dr
- 1009 Woodhill Rd
- 501 Clifton Blvd
- 818 Red Oak Trail
- 1505 Brookpark Dr
- 476 Glendale Blvd
- 823 1 2 Red Oak Trail
- 823 1/2 Red Oak Trail
- 589 Andover Rd
- 1314 Bridgewater Way N
- 646 Kennedy Dr
- 710 Cloverleaf Ct
- 1690 Riva Ridge Dr Unit 1690
- 1696 Riva Ridge Dr
- 1156 Briarwood Rd
- 1330 Whippoorwill Ln
- 1310 Whippoorwill Ln Unit 1310
- 1510 Whippoorwill Ln Unit 1510
- 1520 Whippoorwill Ln Unit 1520
- 1320 Whippoorwill Ln Unit 1320
- 1140 Whippoorwill Ln
- 1130 Whippoorwill Ln Unit 1130
- 1540 Whippoorwill Ln
- 1630 Whippoorwill Ln
- 1030 Whippoorwill Ln
- 630 Whippoorwill Ln
- 610 Whippoorwill Ln Unit 610
- 540 Whippoorwill Ln Unit 540
- 430 Whippoorwill Ln
- 420 Whippoorwill Ln Unit 420
- 410 Whippoorwill Ln Unit 410
- 130 Whippoorwill Ln
- 1620 Whippoorwill Ln
- 1530 Whippoorwill Ln Unit 1530
- 1430 Whippoorwill Ln Unit 1430