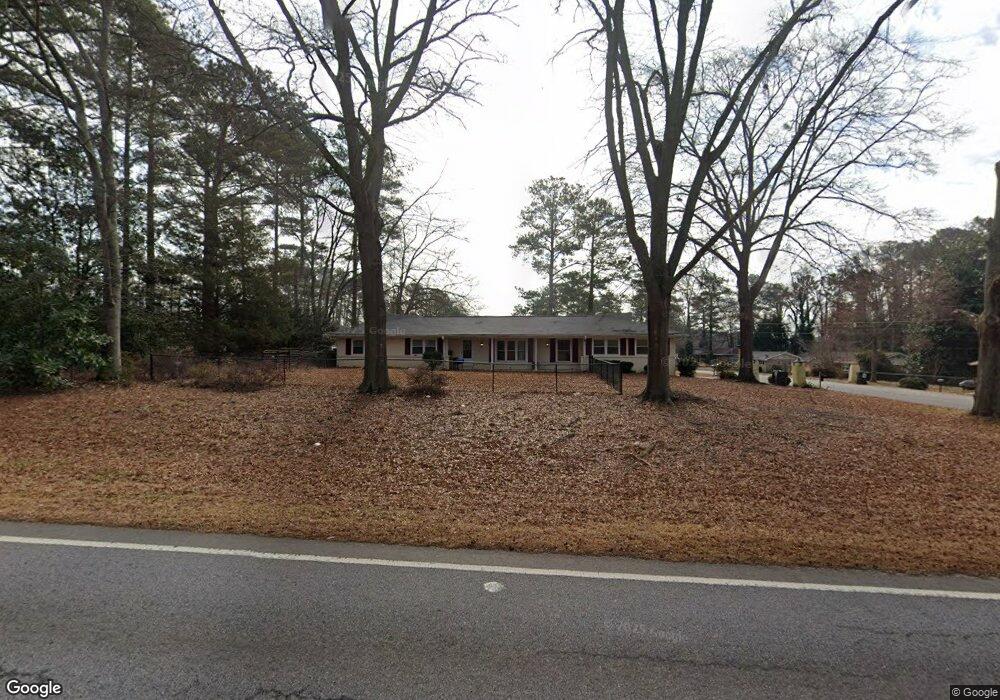
1340 Zebulon Rd Griffin, GA 30224
Spalding County NeighborhoodEstimated Value: $393,000 - $453,000
4
Beds
3
Baths
3,503
Sq Ft
$118/Sq Ft
Est. Value
About This Home
This home is located at 1340 Zebulon Rd, Griffin, GA 30224 and is currently estimated at $411,698, approximately $117 per square foot. 1340 Zebulon Rd is a home located in Spalding County with nearby schools including Crescent Road Elementary School, Rehoboth Road Middle School, and Spalding High School.
Ownership History
Date
Name
Owned For
Owner Type
Purchase Details
Closed on
Mar 27, 2025
Sold by
Batts Samuel L
Bought by
Batts Samantha J and Batts Samuel L
Current Estimated Value
Purchase Details
Closed on
Jul 12, 2017
Sold by
Thrall Sherry
Bought by
Batts Samuel L
Home Financials for this Owner
Home Financials are based on the most recent Mortgage that was taken out on this home.
Original Mortgage
$215,000
Interest Rate
3.91%
Mortgage Type
VA
Purchase Details
Closed on
May 19, 2005
Sold by
Davis Sandra H K and Davis Robert
Bought by
Thrall Sherry
Purchase Details
Closed on
Mar 4, 1985
Sold by
Kendrick Dorothy M
Bought by
Kendrick William M
Purchase Details
Closed on
Oct 29, 1968
Sold by
Kendrick William M and Kendrick Dorothy M
Bought by
Kendrick Dorothy M
Purchase Details
Closed on
May 26, 1967
Sold by
Mathis O N
Bought by
Kendrick W M
Create a Home Valuation Report for This Property
The Home Valuation Report is an in-depth analysis detailing your home's value as well as a comparison with similar homes in the area
Home Values in the Area
Average Home Value in this Area
Purchase History
| Date | Buyer | Sale Price | Title Company |
|---|---|---|---|
| Batts Samantha J | -- | -- | |
| Batts Samuel L | $215,000 | -- | |
| Thrall Sherry | $208,000 | -- | |
| Kendrick William M | -- | -- | |
| Kendrick Dorothy M | -- | -- | |
| Kendrick William M | -- | -- | |
| Kendrick W M | $3,300 | -- |
Source: Public Records
Mortgage History
| Date | Status | Borrower | Loan Amount |
|---|---|---|---|
| Previous Owner | Batts Samuel L | $215,000 |
Source: Public Records
Tax History Compared to Growth
Tax History
| Year | Tax Paid | Tax Assessment Tax Assessment Total Assessment is a certain percentage of the fair market value that is determined by local assessors to be the total taxable value of land and additions on the property. | Land | Improvement |
|---|---|---|---|---|
| 2024 | $969 | $144,095 | $19,000 | $125,095 |
| 2023 | $969 | $101,864 | $19,000 | $82,864 |
| 2022 | $3,274 | $90,026 | $15,200 | $74,826 |
| 2021 | $3,190 | $80,148 | $15,200 | $64,948 |
| 2020 | $2,961 | $74,394 | $15,200 | $59,194 |
| 2019 | $2,904 | $72,955 | $15,200 | $57,755 |
| 2018 | $0 | $71,100 | $15,200 | $55,900 |
| 2017 | $2,417 | $65,016 | $15,200 | $49,816 |
| 2016 | $1,274 | $65,410 | $15,200 | $50,210 |
| 2015 | $1,324 | $65,410 | $15,200 | $50,210 |
| 2014 | $1,368 | $65,410 | $15,200 | $50,210 |
Source: Public Records
Map
Nearby Homes
- 115 Kline Cir
- 1801, 1831 & 19 Zebulon Rd
- 105 Jewel Dr
- 114 Maddox Rd
- 36 Laurelwood Cir
- 7 Crabapple Cir
- 133 Coldwater Ln
- 227 Brown Acres Rd
- TRACT B Zebulon Rd
- 139 Coldwater Ln
- 145 Coldwater Way
- 1064 Cold Water Dr
- 201 Laramie Rd
- 316 Wynterhall Dr
- 0 Martin Luther King jr Pkwy Unit 19-41 BYPASS HIGHWAY
- 102 Summit Dr
- 311 Ashford Place
- 1479 Gloria St
- 1473 Gloria St
- 106 Summit Dr