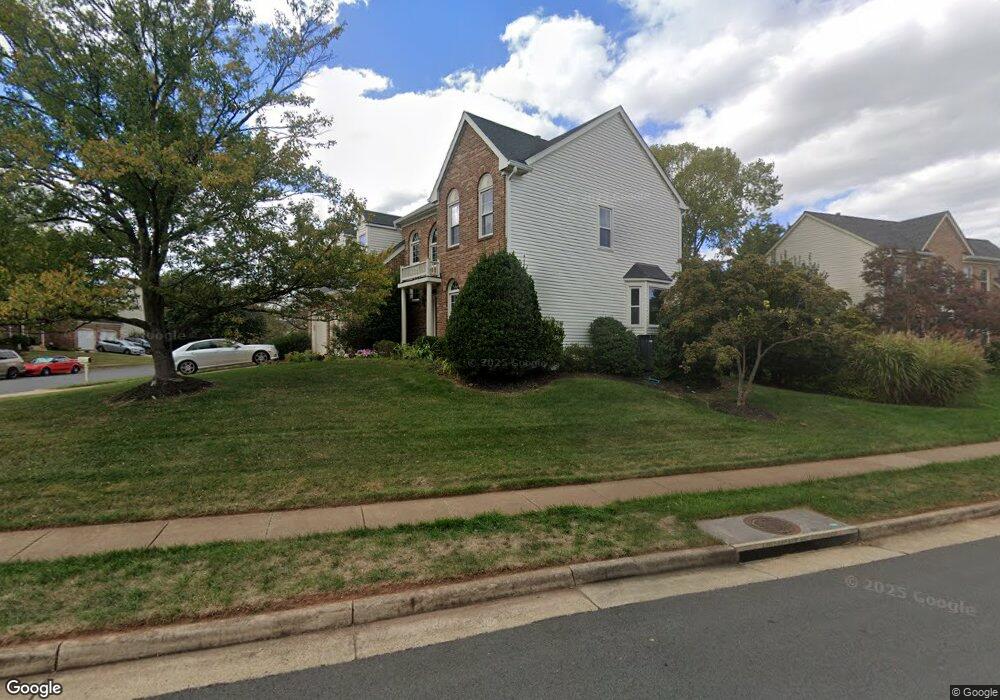
13400 Amy Way Herndon, VA 20171
Oak Hill NeighborhoodEstimated Value: $985,298 - $1,161,000
4
Beds
3
Baths
2,928
Sq Ft
$369/Sq Ft
Est. Value
About This Home
This home is located at 13400 Amy Way, Herndon, VA 20171 and is currently estimated at $1,080,575, approximately $369 per square foot. 13400 Amy Way is a home located in Fairfax County with nearby schools including Oak Hill Elementary School, Franklin Middle, and Chantilly High School.
Ownership History
Date
Name
Owned For
Owner Type
Purchase Details
Closed on
Sep 8, 2021
Sold by
Hart Inna Lazareva and Hart Donald R
Bought by
Hart Donald R and Hart Inna B
Current Estimated Value
Home Financials for this Owner
Home Financials are based on the most recent Mortgage that was taken out on this home.
Original Mortgage
$175,000
Interest Rate
2.88%
Mortgage Type
New Conventional
Purchase Details
Closed on
Jan 31, 2005
Sold by
Prudential Relocation Inc
Bought by
Hart Donald R
Home Financials for this Owner
Home Financials are based on the most recent Mortgage that was taken out on this home.
Original Mortgage
$520,000
Interest Rate
5.83%
Mortgage Type
New Conventional
Purchase Details
Closed on
Jan 17, 2005
Sold by
Degnan Michael J
Bought by
Prudential Relocation Inc
Home Financials for this Owner
Home Financials are based on the most recent Mortgage that was taken out on this home.
Original Mortgage
$520,000
Interest Rate
5.83%
Mortgage Type
New Conventional
Create a Home Valuation Report for This Property
The Home Valuation Report is an in-depth analysis detailing your home's value as well as a comparison with similar homes in the area
Home Values in the Area
Average Home Value in this Area
Purchase History
| Date | Buyer | Sale Price | Title Company |
|---|---|---|---|
| Hart Donald R | -- | Stewart Title Guaranty Company | |
| Hart Donald R | -- | Stewart Title Guaranty Co | |
| Hart Donald R | $650,000 | -- | |
| Prudential Relocation Inc | $650,000 | -- |
Source: Public Records
Mortgage History
| Date | Status | Borrower | Loan Amount |
|---|---|---|---|
| Previous Owner | Hart Donald R | $175,000 | |
| Previous Owner | Hart Donald R | $520,000 |
Source: Public Records
Tax History Compared to Growth
Tax History
| Year | Tax Paid | Tax Assessment Tax Assessment Total Assessment is a certain percentage of the fair market value that is determined by local assessors to be the total taxable value of land and additions on the property. | Land | Improvement |
|---|---|---|---|---|
| 2025 | $10,943 | $1,012,660 | $325,000 | $687,660 |
| 2024 | $10,943 | $944,620 | $300,000 | $644,620 |
| 2023 | $10,853 | $961,700 | $300,000 | $661,700 |
| 2022 | $9,710 | $849,160 | $270,000 | $579,160 |
| 2021 | $8,686 | $740,220 | $250,000 | $490,220 |
| 2020 | $8,179 | $691,050 | $240,000 | $451,050 |
| 2019 | $7,870 | $664,940 | $235,000 | $429,940 |
| 2018 | $7,402 | $643,660 | $230,000 | $413,660 |
| 2017 | $7,473 | $643,660 | $230,000 | $413,660 |
| 2016 | $7,457 | $643,660 | $230,000 | $413,660 |
| 2015 | $6,992 | $626,550 | $220,000 | $406,550 |
| 2014 | $6,794 | $610,150 | $210,000 | $400,150 |
Source: Public Records
Map
Nearby Homes
- 2913 Mother Well Ct
- 3001 Mcmaster Ct
- 2969 Mother Well Ct
- 13127 Frog Hollow Ct
- 3025 Hughsmith Ct
- 3220 Kinross Cir
- 13019 Bankfoot Ct
- 3252 Tayloe Ct
- 3256 Tayloe Ct
- 13486 Foxlease Ct
- 13505 Clear Lake Ct
- 3350 Stone Heather Ct
- 13723 Neil Armstrong Ave Unit 503
- 13009 Farthingale Dr
- 3055 Alan Shepard St
- 13104 Meadow Hall Ct
- 13032 Monterey Estates Dr
- 13430 Hidden Meadow Ct
- 13408 Hidden Meadow Ct
- 13607 Soft Breeze Ct
- 13402 Amy Way
- 3024 Jeannie Anna Ct
- 3025 Jeannie Anna Ct
- 3032 Jeannie Anna Ct
- 3020 Jeannie Anna Ct
- 3027 Jeannie Anna Ct
- 13404 Amy Way
- 13403 Amy Way
- 13406 Amy Way
- 3023 Jeannie Anna Ct
- 3029 Jeannie Anna Ct
- 13405 Amy Way
- 3018 Jeannie Anna Ct
- 3021 Jeannie Anna Ct
- 13408 Amy Way
- 3031 Jeannie Anna Ct
- 3034 Jeannie Anna Ct
- 3033 Jeannie Anna Ct
- 13414 Amy Way
- 13415 Amy Way