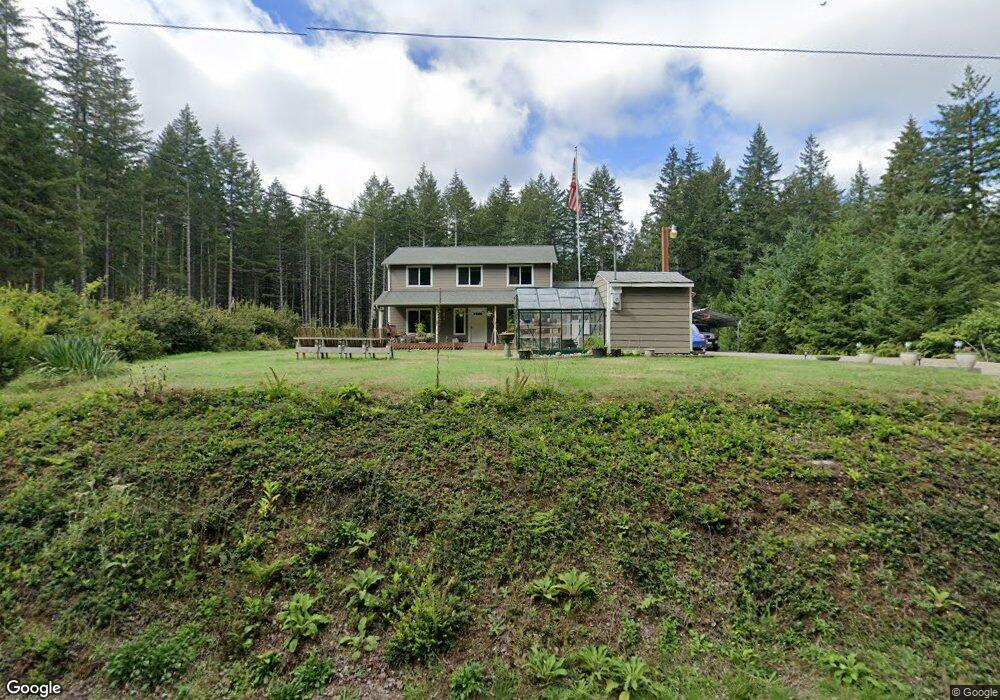
13402 Burchard Dr SW Port Orchard, WA 98367
Estimated Value: $508,000 - $574,000
3
Beds
3
Baths
1,768
Sq Ft
$309/Sq Ft
Est. Value
About This Home
This home is located at 13402 Burchard Dr SW, Port Orchard, WA 98367 and is currently estimated at $547,192, approximately $309 per square foot. 13402 Burchard Dr SW is a home located in Kitsap County with nearby schools including Burley Glenwood Elementary School, Cedar Heights Middle School, and South Kitsap High School.
Ownership History
Date
Name
Owned For
Owner Type
Purchase Details
Closed on
Nov 22, 2021
Sold by
Erekson Jan M
Bought by
Erekson Jan M and Hoffman Darrel P
Current Estimated Value
Purchase Details
Closed on
Aug 21, 2018
Sold by
Leavitt John F and Leavitt Jan E
Bought by
Leavitt Jan E
Home Financials for this Owner
Home Financials are based on the most recent Mortgage that was taken out on this home.
Original Mortgage
$175,025
Outstanding Balance
$152,002
Interest Rate
4.5%
Mortgage Type
New Conventional
Estimated Equity
$395,190
Purchase Details
Closed on
Aug 15, 2017
Sold by
Leavitt John F and Leavitt Jan E
Bought by
Leavitt John F and Leavitt Jan E
Purchase Details
Closed on
Jan 3, 2011
Sold by
Hollis James W and Hollis Perla O
Bought by
Leavitt John F
Home Financials for this Owner
Home Financials are based on the most recent Mortgage that was taken out on this home.
Original Mortgage
$230,000
Interest Rate
4.35%
Mortgage Type
VA
Create a Home Valuation Report for This Property
The Home Valuation Report is an in-depth analysis detailing your home's value as well as a comparison with similar homes in the area
Home Values in the Area
Average Home Value in this Area
Purchase History
| Date | Buyer | Sale Price | Title Company |
|---|---|---|---|
| Erekson Jan M | -- | None Available | |
| Leavitt Jan E | -- | Title Source Inc | |
| Leavitt John F | $281 | None Available | |
| Leavitt John F | $230,280 | Pacific Nw Title |
Source: Public Records
Mortgage History
| Date | Status | Borrower | Loan Amount |
|---|---|---|---|
| Open | Leavitt Jan E | $175,025 | |
| Previous Owner | Leavitt John F | $230,000 |
Source: Public Records
Tax History Compared to Growth
Tax History
| Year | Tax Paid | Tax Assessment Tax Assessment Total Assessment is a certain percentage of the fair market value that is determined by local assessors to be the total taxable value of land and additions on the property. | Land | Improvement |
|---|---|---|---|---|
| 2026 | $3,922 | $445,840 | $44,410 | $401,430 |
| 2025 | $3,922 | $445,840 | $44,410 | $401,430 |
| 2024 | $3,803 | $445,840 | $44,410 | $401,430 |
| 2023 | $3,778 | $445,840 | $44,410 | $401,430 |
| 2022 | $3,743 | $370,310 | $35,470 | $334,840 |
| 2021 | $3,543 | $331,440 | $30,840 | $300,600 |
| 2020 | $3,712 | $338,180 | $31,260 | $306,920 |
| 2019 | $3,169 | $316,460 | $31,260 | $285,200 |
| 2018 | $3,377 | $241,760 | $31,260 | $210,500 |
| 2017 | $2,675 | $241,760 | $31,260 | $210,500 |
| 2016 | $2,614 | $214,600 | $31,260 | $183,340 |
| 2015 | $2,531 | $210,530 | $31,260 | $179,270 |
| 2014 | -- | $210,910 | $39,260 | $171,650 |
| 2013 | -- | $210,910 | $39,260 | $171,650 |
Source: Public Records
Map
Nearby Homes
- 13427 Burchard Dr SW
- 8389 SW Harmon St
- 13102 Burchard Dr SW
- 12199 Burchard Dr SW
- 13540 Carney Lake Rd SW
- 7891 SW Conifer Ln
- 7201 SW Ridgeline Dr
- 11910 Alpine Dr SW
- 5824 Trace Dr SW
- 5844 Trace Dr SW
- 5884 Trace Dr SW
- 6034 Trace Dr SW
- 6023 Trace Dr SW
- 4843 SW Daisy St
- 14610 176th Ave NW
- 13280 Wicks End Ln SW
- 16324 146th St NW
- 13213 Wicks End Ln SW
- 144th 166th St NW
- 15721 Fairview Lake Rd SW
- 13396 Burchard Dr SW
- 13609 Burchard Dr SW
- 13390 Buchard Dr SW
- 13433 Burchard Dr SW
- 8 SW Shirey St
- 13452 Wye Lake Blvd SW
- 13378 Burchard Dr SW
- 8400 SW Shirey St
- 13440 Wye Lake Blvd SW
- 13421 Burchard Dr SW
- 13487 Wye Lake Blvd SW
- 13511 Wye Lake Blvd SW
- 13527 Wye Lake Blvd SW
- 13410 Wye Lake Blvd SW
- 13469 Wye Lake Blvd SW
- 13403 Burchard Dr SW
- 13740 Wye Lake Blvd SW
- 13366 Burchard Dr SW
- 13593 Wye Lake Blvd SW