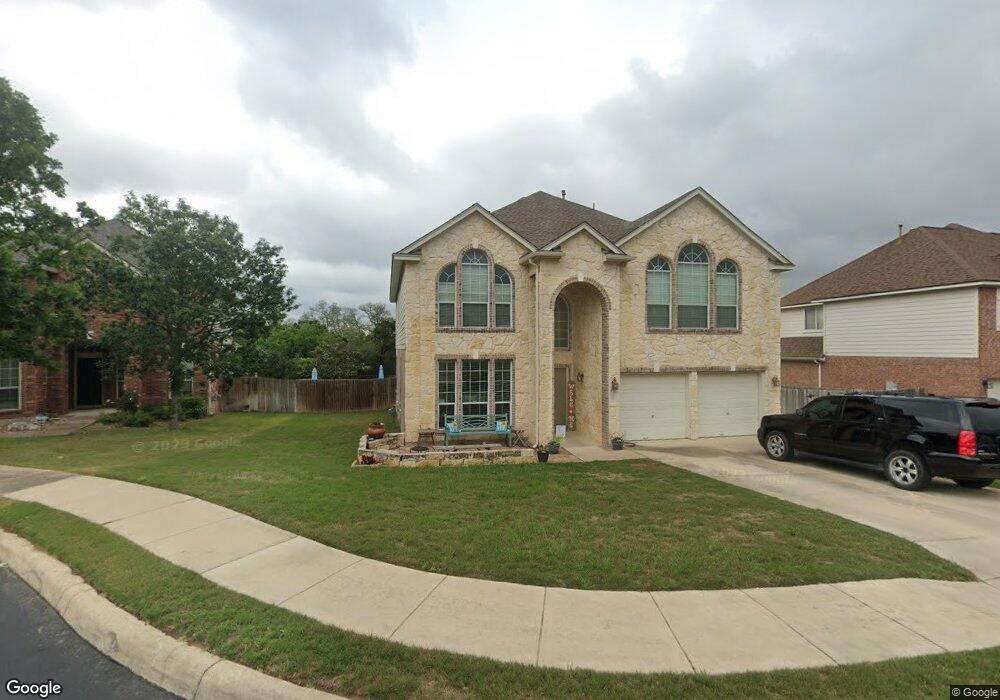
13408 Ribbon Ridge Helotes, TX 78023
Estimated Value: $498,000 - $537,000
5
Beds
3
Baths
3,096
Sq Ft
$166/Sq Ft
Est. Value
About This Home
This home is located at 13408 Ribbon Ridge, Helotes, TX 78023 and is currently estimated at $514,147, approximately $166 per square foot. 13408 Ribbon Ridge is a home located in Bexar County with nearby schools including Kuentz Elementary School, Jefferson Middle School, and O'Connor High School.
Ownership History
Date
Name
Owned For
Owner Type
Purchase Details
Closed on
Jun 4, 2007
Sold by
Turcotte Richard James and Turcotte Calley Rae
Bought by
Williams John B and Williams Jennifer M
Current Estimated Value
Home Financials for this Owner
Home Financials are based on the most recent Mortgage that was taken out on this home.
Original Mortgage
$268,200
Outstanding Balance
$163,843
Interest Rate
6.16%
Mortgage Type
Purchase Money Mortgage
Estimated Equity
$350,304
Purchase Details
Closed on
Oct 26, 2004
Sold by
Pulte Homes Of Texas Lp
Bought by
Turcotte Richard James and Turcotte Calley Rae
Home Financials for this Owner
Home Financials are based on the most recent Mortgage that was taken out on this home.
Original Mortgage
$232,649
Interest Rate
5.25%
Mortgage Type
VA
Create a Home Valuation Report for This Property
The Home Valuation Report is an in-depth analysis detailing your home's value as well as a comparison with similar homes in the area
Home Values in the Area
Average Home Value in this Area
Purchase History
| Date | Buyer | Sale Price | Title Company |
|---|---|---|---|
| Williams John B | -- | Lalt | |
| Turcotte Richard James | -- | -- |
Source: Public Records
Mortgage History
| Date | Status | Borrower | Loan Amount |
|---|---|---|---|
| Open | Williams John B | $268,200 | |
| Previous Owner | Turcotte Richard James | $232,649 |
Source: Public Records
Tax History Compared to Growth
Tax History
| Year | Tax Paid | Tax Assessment Tax Assessment Total Assessment is a certain percentage of the fair market value that is determined by local assessors to be the total taxable value of land and additions on the property. | Land | Improvement |
|---|---|---|---|---|
| 2025 | $8,625 | $548,440 | $120,930 | $427,510 |
| 2024 | $8,625 | $499,125 | $103,600 | $442,810 |
| 2023 | $8,625 | $453,750 | $103,600 | $410,380 |
| 2022 | $9,284 | $412,500 | $86,460 | $422,200 |
| 2021 | $8,976 | $382,100 | $55,450 | $326,650 |
| 2020 | $8,919 | $371,540 | $55,450 | $316,090 |
| 2019 | $8,219 | $332,680 | $55,450 | $277,230 |
| 2018 | $7,899 | $319,490 | $55,450 | $264,040 |
| 2017 | $7,765 | $313,490 | $55,450 | $258,040 |
| 2016 | $7,291 | $294,330 | $55,450 | $238,880 |
| 2015 | $6,542 | $294,320 | $55,450 | $238,870 |
| 2014 | $6,542 | $271,870 | $0 | $0 |
Source: Public Records
Map
Nearby Homes
- 13110 Five Brooks
- 14041 Iron Horse Way
- 10506 Canyon River
- 14125 Iron Horse Way
- 13152 Mystic Saddle
- 20070 Texas 16
- 13402 Rustic Sand
- 11087 Mesquite Flat
- 15034 Iron Horse Way
- 11039 Javalin Trail
- 15149 Marin Hollow
- 0 Texas Highway 16
- 14239
- 433 Private Rd
- 10615 Bar x Trail
- 14465 Chinquapin
- 15125 Flying Cir
- 15352 Texas Highway 16
- 0 Bandera Rd
- 11006 Bar x Trail
- 13404 Ribbon Ridge
- 13412 Ribbon Ridge
- 10623 Spirit Horse
- 10619 Spirit Horse
- 13416 Ribbon Ridge
- 10615 Spirit Horse
- 13407 Ribbon Ridge
- 13411 Ribbon Ridge
- 13415 Ribbon Ridge
- 13403 Ribbon Ridge
- 10707 Spirit Horse
- 10611 Spirit Horse
- 10607 Spirit Horse
- 10711 Spirit Horse
- 10618 Spirit Horse
- 10622 Spirit Horse
- 10702 Spirit Horse
- 10614 Spirit Horse
- 10706 Spirit Horse
- 10610 Spirit Horse