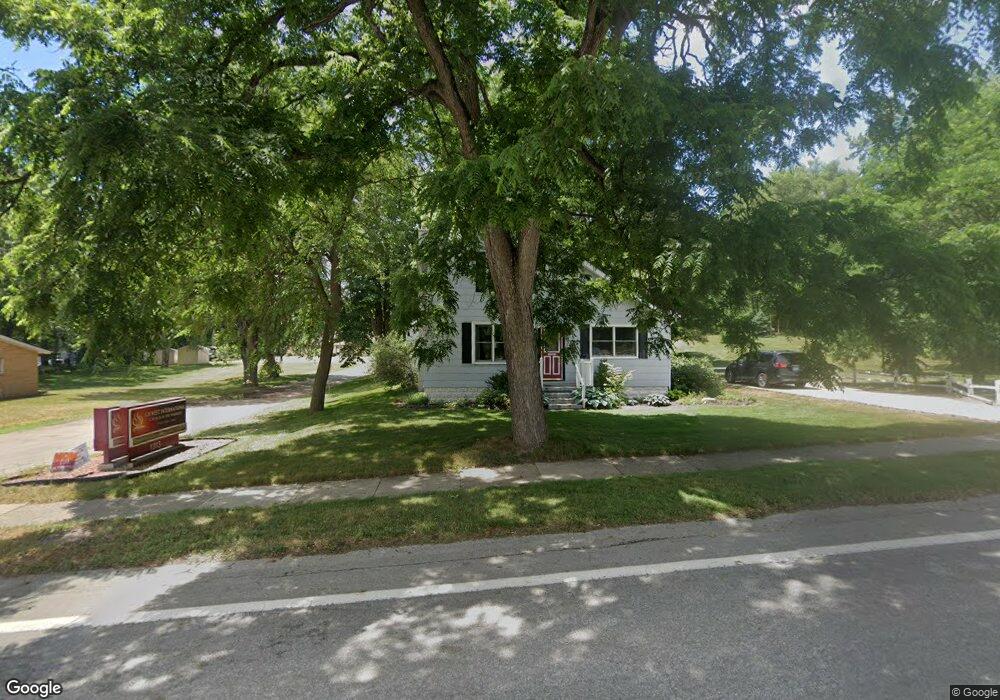
1341 Bristol Ave NW Grand Rapids, MI 49504
Westside Connection NeighborhoodEstimated Value: $284,000 - $331,000
3
Beds
1
Bath
1,492
Sq Ft
$206/Sq Ft
Est. Value
About This Home
This home is located at 1341 Bristol Ave NW, Grand Rapids, MI 49504 and is currently estimated at $307,502, approximately $206 per square foot. 1341 Bristol Ave NW is a home located in Kent County with nearby schools including Harrison Elementary School, Westwood Middle School, and Union High School.
Ownership History
Date
Name
Owned For
Owner Type
Purchase Details
Closed on
Feb 25, 2010
Sold by
Scholten Joshua P and Scholten Andrea C
Bought by
Scholten Joshua P and Scholten Andrea C
Current Estimated Value
Home Financials for this Owner
Home Financials are based on the most recent Mortgage that was taken out on this home.
Original Mortgage
$60,000
Outstanding Balance
$39,846
Interest Rate
5.02%
Mortgage Type
New Conventional
Estimated Equity
$267,656
Purchase Details
Closed on
Nov 12, 2009
Sold by
Stinchcomb Bruce A
Bought by
Scholten Joshua
Purchase Details
Closed on
May 15, 1997
Bought by
Scholten Stinchcomb B and Scholten Joshua P Andrea C
Purchase Details
Closed on
Oct 16, 1991
Sold by
Byle Byle B B and Byle Gerczak M
Bought by
Scholten Joshua P Andrea C
Purchase Details
Closed on
Aug 24, 1989
Bought by
Scholten Joshua P Andrea C
Purchase Details
Closed on
Jul 17, 1987
Bought by
Scholten Joshua P Andrea C
Purchase Details
Closed on
Jul 16, 1987
Bought by
Scholten Joshua P Andrea C
Create a Home Valuation Report for This Property
The Home Valuation Report is an in-depth analysis detailing your home's value as well as a comparison with similar homes in the area
Home Values in the Area
Average Home Value in this Area
Purchase History
| Date | Buyer | Sale Price | Title Company |
|---|---|---|---|
| Scholten Joshua P | -- | The Closing Office Title Age | |
| Scholten Joshua | $83,000 | Chicago Title | |
| Scholten Stinchcomb B | $76,000 | -- | |
| Scholten Joshua P Andrea C | $63,500 | -- | |
| Scholten Joshua P Andrea C | $60,000 | -- | |
| Scholten Joshua P Andrea C | $34,500 | -- | |
| Scholten Joshua P Andrea C | $9,300 | -- |
Source: Public Records
Mortgage History
| Date | Status | Borrower | Loan Amount |
|---|---|---|---|
| Open | Scholten Joshua P | $60,000 |
Source: Public Records
Tax History Compared to Growth
Tax History
| Year | Tax Paid | Tax Assessment Tax Assessment Total Assessment is a certain percentage of the fair market value that is determined by local assessors to be the total taxable value of land and additions on the property. | Land | Improvement |
|---|---|---|---|---|
| 2025 | $1,809 | $124,500 | $0 | $0 |
| 2024 | $1,809 | $114,500 | $0 | $0 |
| 2023 | $1,836 | $101,600 | $0 | $0 |
| 2022 | $1,743 | $88,900 | $0 | $0 |
| 2021 | $1,704 | $84,100 | $0 | $0 |
| 2020 | $1,629 | $77,600 | $0 | $0 |
| 2019 | $1,648 | $66,300 | $0 | $0 |
| 2018 | $1,648 | $58,800 | $0 | $0 |
| 2017 | $1,604 | $50,600 | $0 | $0 |
| 2016 | $1,623 | $49,400 | $0 | $0 |
| 2015 | $1,510 | $49,400 | $0 | $0 |
| 2013 | -- | $44,400 | $0 | $0 |
Source: Public Records
Map
Nearby Homes
- 1611 Lockhart Dr NW
- 1362 Myrtle St NW
- 1835 Kerwin St NW
- 1130 Haines St NW
- 1440 Holborn Dr NW
- 1071 Bristol Ave NW
- 1457 Valley Ave NW
- 1126 Edison Ave NW
- 1840 Richmond St NW
- 1439 Parkhurst Ave NW
- 1462 Walker Ave NW
- 1500 Hillcrest Ave NW
- 1355 Hillcrest Ave NW
- 1232 Arianna St NW
- 1029 Woodrow Ave NW
- 1317 Morgan St NW
- 1459 Garfield Ave NW
- 1221 Garfield Ave NW
- 1753 Preston Ave NW
- 1200 Leonard St NW
- 1355 Bristol Ave NW
- 1365 Bristol Ave NW
- 1407 Bristol Ave NW
- 1682 Lockhart Ave NW
- 1673 Walker Ave NW
- 1682 Lockhart Dr NW
- 1417 Bristol Ave NW
- 1655 Walker Ave NW
- 1681 Lockhart Ave NW
- 1681 Lockhart Dr NW
- 1659 Walker Ave NW
- 1676 Lockhart Ave NW
- 1651 Walker Ave NW
- 1677 Walker Ave NW
- 1665 Walker Ave NW
- 1612 Lockhart Ave NW
- 1671 Lockhart Ave NW
- 1671 Lockhart Dr NW
- 1634 Lockhart Ave NW
- 960 Bristol Ave NW