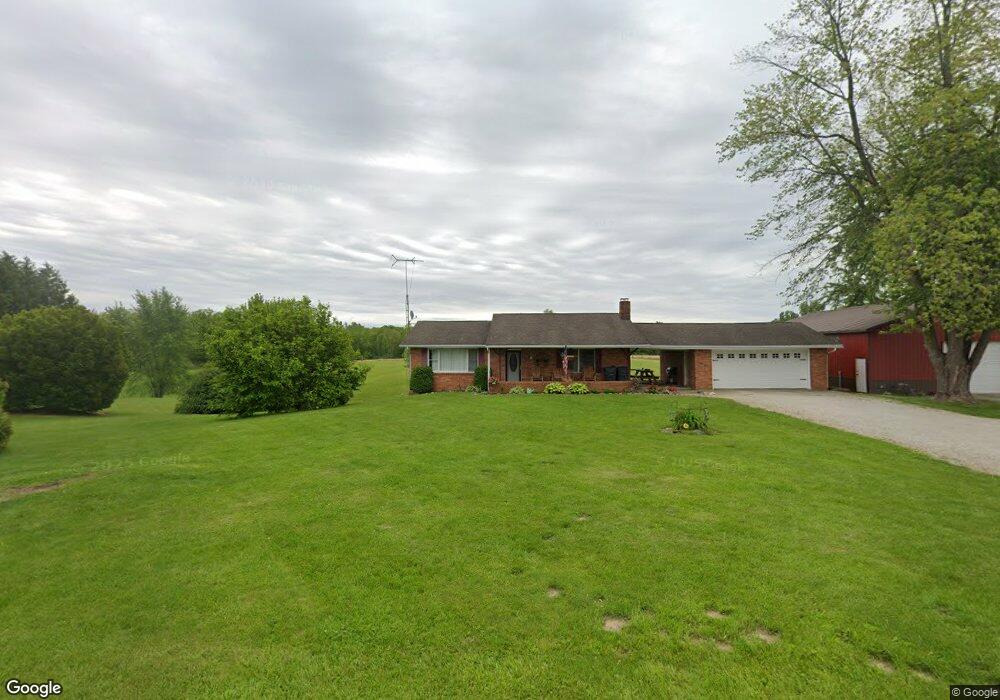
1341 E County Road 600 N New Castle, IN 47362
Estimated Value: $196,000 - $234,897
4
Beds
2
Baths
1,176
Sq Ft
$184/Sq Ft
Est. Value
About This Home
This home is located at 1341 E County Road 600 N, New Castle, IN 47362 and is currently estimated at $216,224, approximately $183 per square foot. 1341 E County Road 600 N is a home located in Henry County with nearby schools including Blue River Valley Elementary School and Blue River Valley Junior/Senior High School.
Ownership History
Date
Name
Owned For
Owner Type
Purchase Details
Closed on
Aug 31, 2011
Sold by
Mckinley Jenna L
Bought by
Mckinley Branden L
Current Estimated Value
Purchase Details
Closed on
Mar 5, 2010
Sold by
Mckinley Branden
Bought by
Mckinley Branden L and Mckinley Jenna L
Home Financials for this Owner
Home Financials are based on the most recent Mortgage that was taken out on this home.
Original Mortgage
$78,400
Outstanding Balance
$8,886
Interest Rate
5.01%
Mortgage Type
Purchase Money Mortgage
Estimated Equity
$207,338
Purchase Details
Closed on
Dec 20, 2007
Sold by
Citimortgage Inc
Bought by
Mckinley Branden
Home Financials for this Owner
Home Financials are based on the most recent Mortgage that was taken out on this home.
Original Mortgage
$65,900
Interest Rate
6.17%
Mortgage Type
New Conventional
Purchase Details
Closed on
Oct 18, 2007
Sold by
Witcher Michael E and Witcher Deborah S
Bought by
Citimortgage Inc
Create a Home Valuation Report for This Property
The Home Valuation Report is an in-depth analysis detailing your home's value as well as a comparison with similar homes in the area
Home Values in the Area
Average Home Value in this Area
Purchase History
| Date | Buyer | Sale Price | Title Company |
|---|---|---|---|
| Mckinley Branden L | -- | None Available | |
| Mckinley Branden L | -- | None Available | |
| Mckinley Branden | -- | None Available | |
| Citimortgage Inc | $88,500 | None Available |
Source: Public Records
Mortgage History
| Date | Status | Borrower | Loan Amount |
|---|---|---|---|
| Open | Mckinley Branden L | $78,400 | |
| Closed | Mckinley Branden | $65,900 |
Source: Public Records
Tax History Compared to Growth
Tax History
| Year | Tax Paid | Tax Assessment Tax Assessment Total Assessment is a certain percentage of the fair market value that is determined by local assessors to be the total taxable value of land and additions on the property. | Land | Improvement |
|---|---|---|---|---|
| 2024 | $1,347 | $136,600 | $32,600 | $104,000 |
| 2023 | $1,334 | $124,700 | $32,600 | $92,100 |
| 2022 | $1,412 | $124,600 | $28,000 | $96,600 |
| 2021 | $1,183 | $109,300 | $28,000 | $81,300 |
| 2020 | $1,222 | $107,700 | $28,000 | $79,700 |
| 2019 | $1,050 | $106,000 | $28,000 | $78,000 |
| 2018 | $978 | $103,300 | $26,400 | $76,900 |
| 2017 | $1,035 | $110,100 | $26,400 | $83,700 |
| 2016 | $973 | $108,600 | $25,900 | $82,700 |
| 2014 | $928 | $104,200 | $25,400 | $78,800 |
| 2013 | $928 | $102,600 | $25,900 | $76,700 |
Source: Public Records
Map
Nearby Homes
- 6902 N County Road 175 E
- 79 E Edgewood Dr
- 6990 N Hickory Ln
- 300 S Walnut St
- 208 W Main St
- 180 S Summit St
- 9029 N State Road 3
- 0 N County Road 50 E
- 0 N County Road 200 W
- 4050 E County Road 800 S
- Warren Plan at Ashbury Fields
- Birch Plan at Ashbury Fields
- Woodburn Plan at Ashbury Fields
- Hanover Plan at Ashbury Fields
- 000 N County Road 550 E
- 4797 N County Road 550 E
- 2746 N Memorial Dr
- 2504 NW Raintree Dr
- 5694 E State Road 36
- 5694 E US Highway 36
- 1469 E County Road 600 N
- 1484 E County Road 600 N
- 1266 E County Road 600 N
- 1542 E County Road 600 N
- 1289 E County Road 600 N
- 1655 E County Road 600 N
- 1228 E County Road 600 N
- 1376 E County Road 600 N
- 1672 E County Road 600 N
- 1770 E County Road 600 N
- 1374 E County Road 600 N
- 1800 E County Road 600 N
- 6025 N County Road 100 E
- 1877 E County Road 600 N
- 1877 E County Road 600 N
- N County Road 100 E
- 6224 N County Road 100 E
- 1990 E County Road 600 N
- 5794 N County Road 100 E
- 6268 N County Road 100 E