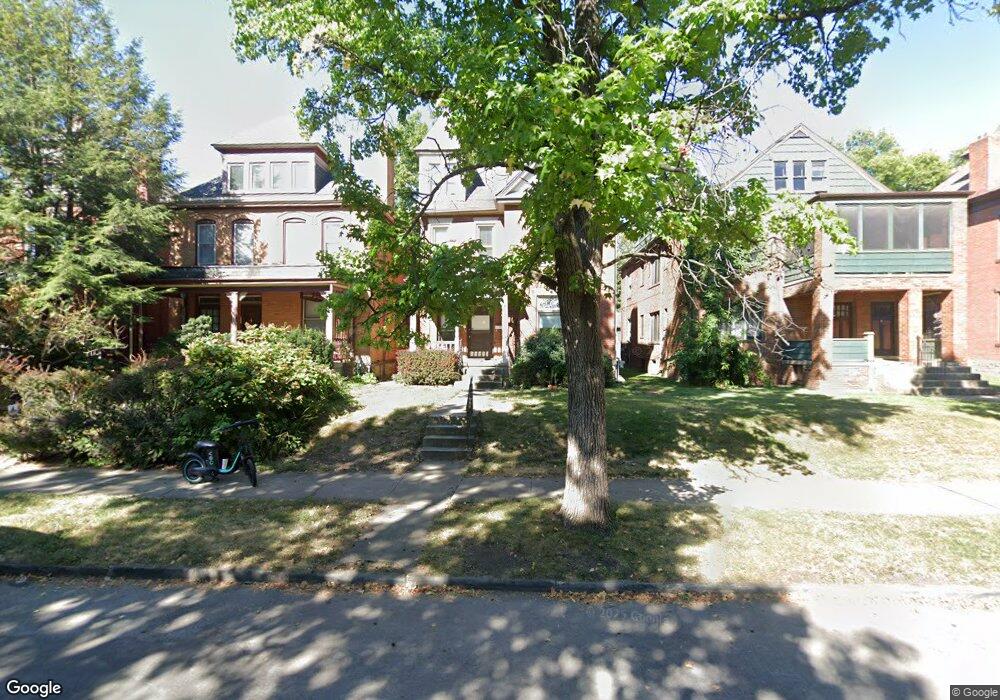
1341 Highland St Unit 343 Columbus, OH 43201
Dennison Place NeighborhoodEstimated Value: $512,000 - $546,000
4
Beds
2
Baths
2,337
Sq Ft
$227/Sq Ft
Est. Value
About This Home
This home is located at 1341 Highland St Unit 343, Columbus, OH 43201 and is currently estimated at $529,751, approximately $226 per square foot. 1341 Highland St Unit 343 is a home located in Franklin County with nearby schools including Hubbard Elementary School, Dominion Middle School, and Whetstone High School.
Ownership History
Date
Name
Owned For
Owner Type
Purchase Details
Closed on
Jun 25, 2003
Sold by
Damron Patty J and Damron Glenn E
Bought by
Damron Glenn E and Damron Patty J
Current Estimated Value
Purchase Details
Closed on
Jun 2, 2002
Sold by
Damron Glenn E and Damron Patty J
Bought by
Bueltmann Mark T and Bueltmann Trese
Home Financials for this Owner
Home Financials are based on the most recent Mortgage that was taken out on this home.
Original Mortgage
$190,000
Interest Rate
3.65%
Mortgage Type
Purchase Money Mortgage
Purchase Details
Closed on
Sep 4, 1984
Bought by
Damron Patty J
Purchase Details
Closed on
Sep 1, 1984
Create a Home Valuation Report for This Property
The Home Valuation Report is an in-depth analysis detailing your home's value as well as a comparison with similar homes in the area
Home Values in the Area
Average Home Value in this Area
Purchase History
| Date | Buyer | Sale Price | Title Company |
|---|---|---|---|
| Damron Glenn E | -- | -- | |
| Bueltmann Mark T | $190,000 | None Available | |
| Damron Patty J | -- | -- | |
| -- | $58,500 | -- |
Source: Public Records
Mortgage History
| Date | Status | Borrower | Loan Amount |
|---|---|---|---|
| Previous Owner | Bueltmann Mark T | $190,000 |
Source: Public Records
Tax History Compared to Growth
Tax History
| Year | Tax Paid | Tax Assessment Tax Assessment Total Assessment is a certain percentage of the fair market value that is determined by local assessors to be the total taxable value of land and additions on the property. | Land | Improvement |
|---|---|---|---|---|
| 2024 | $6,562 | $143,190 | $48,760 | $94,430 |
| 2023 | $6,480 | $143,185 | $48,755 | $94,430 |
| 2022 | $7,606 | $143,120 | $28,210 | $114,910 |
| 2021 | $7,619 | $143,120 | $28,210 | $114,910 |
| 2020 | $7,631 | $143,120 | $28,210 | $114,910 |
| 2019 | $6,845 | $110,080 | $21,700 | $88,380 |
| 2018 | $5,739 | $110,080 | $21,700 | $88,380 |
| 2017 | $5,972 | $110,080 | $21,700 | $88,380 |
| 2016 | $5,101 | $75,080 | $20,090 | $54,990 |
| 2015 | $4,644 | $75,080 | $20,090 | $54,990 |
| 2014 | $4,655 | $75,080 | $20,090 | $54,990 |
| 2013 | $2,034 | $66,500 | $18,270 | $48,230 |
Source: Public Records
Map
Nearby Homes
- 154-156 W 6th Ave
- 1298 Hunter Ave
- 93 King Ave Unit 95
- 63 Smith Place
- 1438-1440 Hunter Ave
- 42 King Ave
- 6 1/2 Clark Place
- 343 King Ave Unit 345
- 398 W 5th Ave
- 1245 Pennsylvania Ave
- 1276 N High St Unit 206
- 1276 N High St Unit 402
- 396 W 7th Ave
- 30 W 4th Ave
- 1145 N High St Unit 203
- 1145 N High St Unit 307
- 18 W 4th Ave
- 49 Euclid Ave
- 1325 Indianola Ave Unit 325
- 1042 Neil Ave
- 1337 Highland St
- 1347 Highland St Unit 345
- 1333 Highland St
- 196 W 6th Ave Unit 198
- 198 W 6th Ave
- 1353 Highland St
- 1359 Highland St
- 1361 Highland St Unit 361
- 1352 Forsythe Ave
- 1354 Forsythe Ave
- 1346 Forsythe Ave
- 1321 Highland St Unit 1321
- 1319 Highland St Unit 321
- 193 W 6th Ave Unit 197
- 1342 Forsythe Ave Unit 342
- 1364 Forsythe Ave
- 1367 Highland St Unit 367
- 1332 Highland St
- 203 W 6th Ave Unit 205
- 1342 Highland St