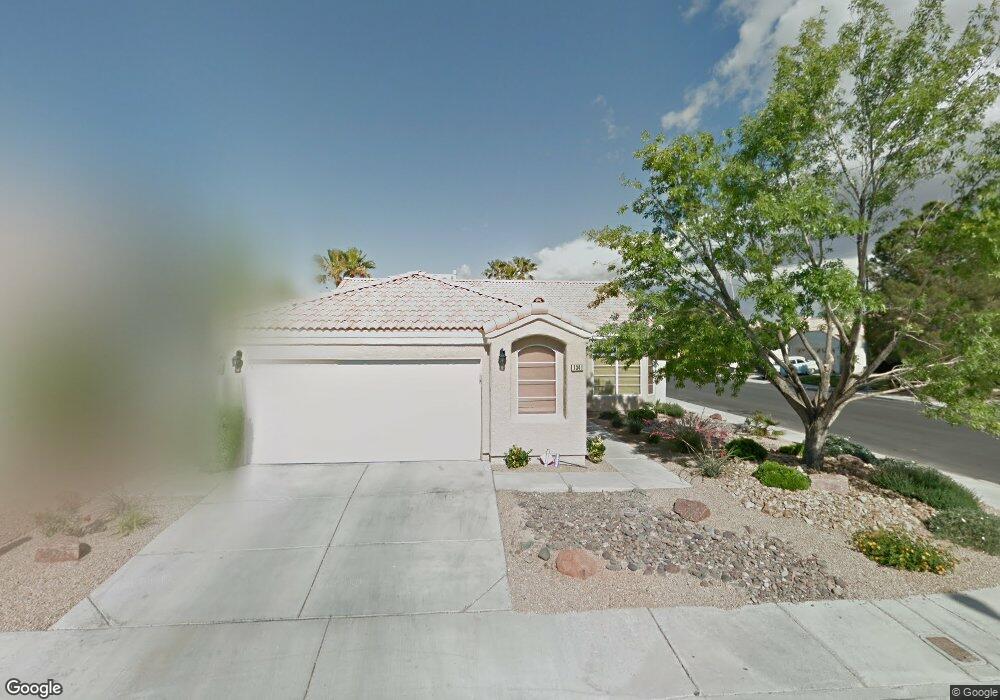
1341 Maplegrove Cir Las Vegas, NV 89108
Michael Way NeighborhoodEstimated Value: $403,304 - $426,000
2
Beds
2
Baths
1,572
Sq Ft
$266/Sq Ft
Est. Value
About This Home
This home is located at 1341 Maplegrove Cir, Las Vegas, NV 89108 and is currently estimated at $418,326, approximately $266 per square foot. 1341 Maplegrove Cir is a home located in Clark County with nearby schools including Paul E. Culley Elementary School, Frank F Garside Junior High School, and Western High School.
Ownership History
Date
Name
Owned For
Owner Type
Purchase Details
Closed on
Aug 26, 2016
Sold by
Cale Lynn E
Bought by
Cale Lynn and Lynn Cale Living Trust
Current Estimated Value
Home Financials for this Owner
Home Financials are based on the most recent Mortgage that was taken out on this home.
Original Mortgage
$168,000
Outstanding Balance
$134,278
Interest Rate
3.45%
Mortgage Type
New Conventional
Estimated Equity
$284,048
Purchase Details
Closed on
Mar 24, 2014
Sold by
Cale Lynn
Bought by
Lynn Cale Living Trust
Purchase Details
Closed on
Jun 28, 1999
Sold by
Pomrenze Sandra L
Bought by
Cale Lynn E
Home Financials for this Owner
Home Financials are based on the most recent Mortgage that was taken out on this home.
Original Mortgage
$111,200
Interest Rate
7.2%
Create a Home Valuation Report for This Property
The Home Valuation Report is an in-depth analysis detailing your home's value as well as a comparison with similar homes in the area
Home Values in the Area
Average Home Value in this Area
Purchase History
| Date | Buyer | Sale Price | Title Company |
|---|---|---|---|
| Cale Lynn | -- | Chicago Title Of Nevada | |
| Cale Lynn E | -- | Chicago Title Of Nevada | |
| Lynn Cale Living Trust | -- | None Available | |
| Cale Lynn E | $139,000 | Old Republic Title Company |
Source: Public Records
Mortgage History
| Date | Status | Borrower | Loan Amount |
|---|---|---|---|
| Open | Cale Lynn E | $168,000 | |
| Previous Owner | Cale Lynn E | $111,200 | |
| Closed | Cale Lynn E | $13,900 |
Source: Public Records
Tax History Compared to Growth
Tax History
| Year | Tax Paid | Tax Assessment Tax Assessment Total Assessment is a certain percentage of the fair market value that is determined by local assessors to be the total taxable value of land and additions on the property. | Land | Improvement |
|---|---|---|---|---|
| 2025 | $1,791 | $88,498 | $28,350 | $60,148 |
| 2024 | $1,740 | $88,498 | $28,350 | $60,148 |
| 2023 | $1,740 | $85,638 | $28,000 | $57,638 |
| 2022 | $1,852 | $75,701 | $22,400 | $53,301 |
| 2021 | $1,715 | $71,978 | $21,000 | $50,978 |
| 2020 | $1,589 | $70,819 | $19,950 | $50,869 |
| 2019 | $1,490 | $66,934 | $16,450 | $50,484 |
| 2018 | $1,421 | $63,434 | $14,350 | $49,084 |
| 2017 | $2,068 | $63,077 | $12,950 | $50,127 |
| 2016 | $1,331 | $60,968 | $10,500 | $50,468 |
| 2015 | $1,328 | $48,563 | $5,950 | $42,613 |
| 2014 | $1,287 | $38,077 | $4,900 | $33,177 |
Source: Public Records
Map
Nearby Homes
- 6224 Mandarin Dr
- 6208 Mandarin Dr
- 6205 Carmen Blvd
- 6229 Saginaw Dr
- 6308 Mint Frost Way
- 1336 N Jones Blvd
- 1452 N Jones Blvd
- 6336 Copperfield Ave
- 6380 Mint Frost Way
- 6008 Pebble Beach Blvd
- 1116 N Jones Blvd
- 1617 Joshua Tree Ct
- 1209 Coral Isle Way
- 5908 Forrest Hills Ln
- 1600 N Torrey Pines Dr Unit 202
- 1600 N Torrey Pines Dr Unit 101
- 6325 W Washington Ave
- 5939 Vegas Dr
- 1706 N Jones Blvd
- 1624 N Torrey Pines Dr Unit 104
- 1340 Date Palm Cir
- 1336 Date Palm Cir
- 6244 Small Point Dr
- 6248 Small Point Dr
- 6240 Small Point Dr
- 1332 Date Palm Cir
- 1329 Maplegrove Cir
- 1340 Maplegrove Cir
- 6252 Small Point Dr
- 1336 Maplegrove Cir
- 6236 Small Point Dr
- 1332 Maplegrove Cir
- 1328 Date Palm Cir
- 6256 Small Point Dr
- 6256 Small Point Dr
- 6256 Small Point Dr Unit na
- 6232 Small Point Dr
- 1325 Maplegrove Cir
- 1328 Maplegrove Cir
- 6249 Mandarin Dr