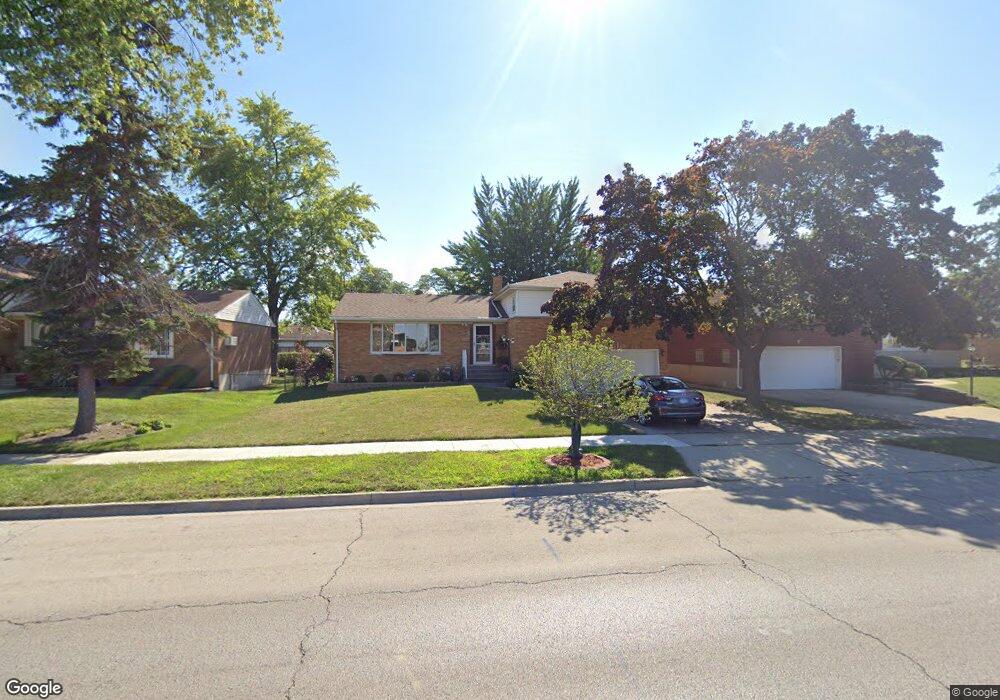
1341 N 9th Ave Melrose Park, IL 60160
North Maywood NeighborhoodEstimated Value: $418,418 - $438,000
4
Beds
3
Baths
1,918
Sq Ft
$223/Sq Ft
Est. Value
About This Home
This home is located at 1341 N 9th Ave, Melrose Park, IL 60160 and is currently estimated at $428,105, approximately $223 per square foot. 1341 N 9th Ave is a home located in Cook County with nearby schools including Jane Addams Elementary School, Stevenson Middle School, and Proviso East High School.
Ownership History
Date
Name
Owned For
Owner Type
Purchase Details
Closed on
Nov 30, 2001
Sold by
Lamb Frederick W and Lamb Lucille A
Bought by
Sacco Saponaro Pietro and Sacco Saponaro Jeanette
Current Estimated Value
Home Financials for this Owner
Home Financials are based on the most recent Mortgage that was taken out on this home.
Original Mortgage
$156,000
Outstanding Balance
$63,216
Interest Rate
7.07%
Estimated Equity
$364,889
Create a Home Valuation Report for This Property
The Home Valuation Report is an in-depth analysis detailing your home's value as well as a comparison with similar homes in the area
Home Values in the Area
Average Home Value in this Area
Purchase History
| Date | Buyer | Sale Price | Title Company |
|---|---|---|---|
| Sacco Saponaro Pietro | $245,000 | -- |
Source: Public Records
Mortgage History
| Date | Status | Borrower | Loan Amount |
|---|---|---|---|
| Open | Sacco Saponaro Pietro | $156,000 |
Source: Public Records
Tax History Compared to Growth
Tax History
| Year | Tax Paid | Tax Assessment Tax Assessment Total Assessment is a certain percentage of the fair market value that is determined by local assessors to be the total taxable value of land and additions on the property. | Land | Improvement |
|---|---|---|---|---|
| 2024 | $7,284 | $34,000 | $4,550 | $29,450 |
| 2023 | $5,342 | $34,000 | $4,550 | $29,450 |
| 2022 | $5,342 | $23,491 | $3,900 | $19,591 |
| 2021 | $5,474 | $23,491 | $3,900 | $19,591 |
| 2020 | $5,447 | $23,491 | $3,900 | $19,591 |
| 2019 | $5,207 | $22,235 | $3,575 | $18,660 |
| 2018 | $6,072 | $22,235 | $3,575 | $18,660 |
| 2017 | $5,955 | $22,235 | $3,575 | $18,660 |
| 2016 | $5,240 | $18,846 | $3,250 | $15,596 |
| 2015 | $5,119 | $18,846 | $3,250 | $15,596 |
| 2014 | $4,976 | $18,846 | $3,250 | $15,596 |
| 2013 | $5,171 | $21,053 | $3,250 | $17,803 |
Source: Public Records
Map
Nearby Homes