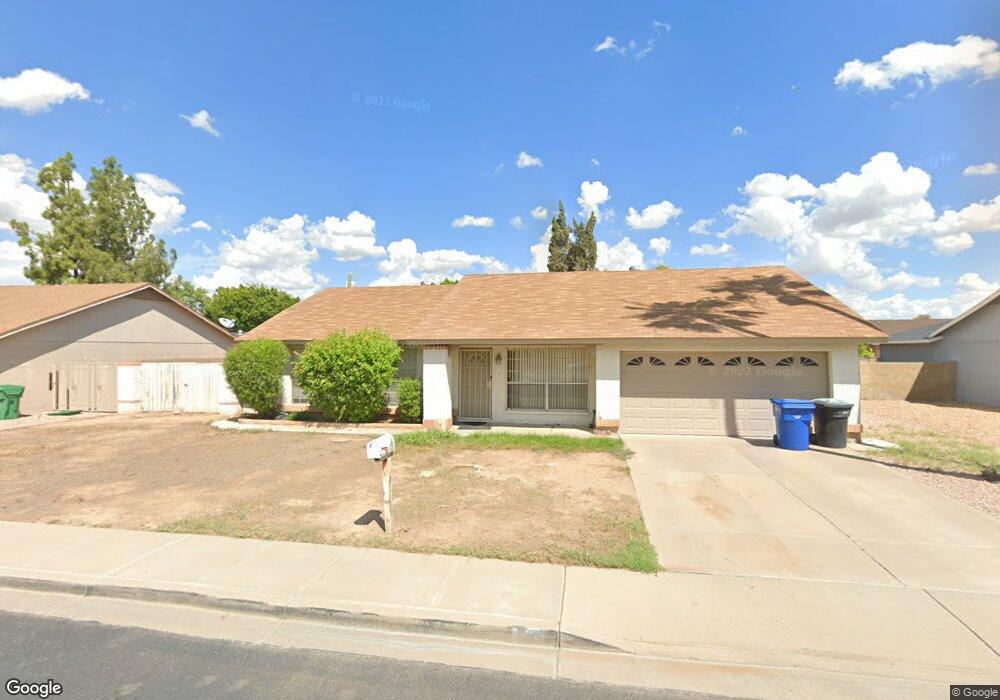
1341 N Matlock Mesa, AZ 85203
North Central Mesa NeighborhoodEstimated Value: $376,524 - $445,000
3
Beds
2
Baths
1,610
Sq Ft
$265/Sq Ft
Est. Value
About This Home
This home is located at 1341 N Matlock, Mesa, AZ 85203 and is currently estimated at $426,131, approximately $264 per square foot. 1341 N Matlock is a home located in Maricopa County with nearby schools including Edison Elementary School, Franklin at Brimhall Elementary School, and Franklin West Elementary School.
Ownership History
Date
Name
Owned For
Owner Type
Purchase Details
Closed on
Feb 8, 2005
Sold by
Phillips Sterling W and Phillips Judy A
Bought by
Sterling Property Management Llc
Current Estimated Value
Purchase Details
Closed on
Jul 9, 2004
Sold by
Bluth Susan M
Bought by
Phillips Sterling and Phillips Judy Ann
Home Financials for this Owner
Home Financials are based on the most recent Mortgage that was taken out on this home.
Original Mortgage
$124,000
Interest Rate
6.12%
Mortgage Type
Purchase Money Mortgage
Purchase Details
Closed on
Feb 19, 2003
Sold by
Bluth Martin S
Bought by
Bluth Susan M
Home Financials for this Owner
Home Financials are based on the most recent Mortgage that was taken out on this home.
Original Mortgage
$117,600
Interest Rate
5.93%
Mortgage Type
Purchase Money Mortgage
Create a Home Valuation Report for This Property
The Home Valuation Report is an in-depth analysis detailing your home's value as well as a comparison with similar homes in the area
Home Values in the Area
Average Home Value in this Area
Purchase History
| Date | Buyer | Sale Price | Title Company |
|---|---|---|---|
| Sterling Property Management Llc | -- | None Available | |
| Phillips Sterling | $155,000 | Equity Title Agency Inc | |
| Bluth Susan M | -- | Security Title Agency | |
| Bluth Susan M | -- | Security Title Agency |
Source: Public Records
Mortgage History
| Date | Status | Borrower | Loan Amount |
|---|---|---|---|
| Previous Owner | Phillips Sterling | $124,000 | |
| Previous Owner | Bluth Susan M | $117,600 |
Source: Public Records
Tax History
| Year | Tax Paid | Tax Assessment Tax Assessment Total Assessment is a certain percentage of the fair market value that is determined by local assessors to be the total taxable value of land and additions on the property. | Land | Improvement |
|---|---|---|---|---|
| 2025 | $1,684 | $17,064 | -- | -- |
| 2024 | $1,689 | $16,252 | -- | -- |
| 2023 | $1,689 | $31,020 | $6,200 | $24,820 |
| 2022 | $1,654 | $23,650 | $4,730 | $18,920 |
| 2021 | $1,674 | $21,860 | $4,370 | $17,490 |
| 2020 | $1,652 | $20,270 | $4,050 | $16,220 |
| 2019 | $1,544 | $18,250 | $3,650 | $14,600 |
| 2018 | $1,482 | $16,280 | $3,250 | $13,030 |
| 2017 | $1,437 | $15,660 | $3,130 | $12,530 |
| 2016 | $1,411 | $15,010 | $3,000 | $12,010 |
| 2015 | $1,326 | $13,220 | $2,640 | $10,580 |
Source: Public Records
Map
Nearby Homes
- 1116 E Hackamore St
- 953 E Hackamore St
- 1204 E Glencove Cir
- 1232 E Granada St
- 1550 N Stapley Dr Unit 6
- 1550 N Stapley Dr Unit 15
- 1550 N Stapley Dr Unit 48
- 1550 N Stapley Dr Unit 134
- 1535 N Horne -- Unit 75
- 860 E Brown Rd Unit 29
- 1304 E Hackamore St
- 1044 E Indigo St
- 1232 E Mclellan Rd
- 1036 E Fairfield St
- 1360 E Brown Rd Unit 2
- 1047 E Fairfield St
- 1313 N Delmar
- 959 E Fairfield St
- 1657 N Doran
- 1663 N Doran
- 1347 N Matlock
- 1335 N Matlock
- 1346 N Amber
- 1338 N Amber
- 1031 E Huber St
- 1334 N Amber
- 1353 N Matlock
- 1317 N Matlock
- 1354 N Amber
- 1021 E Huber St
- 1326 N Amber
- 1024 E Grandview St
- 1352 N Matlock
- 1049 E Grandview St
- 1105 E Hackamore St
- 1035 E Halifax St
- 1041 E Halifax St
- 1104 E Huber St
- 1035 E Grandview St
- 1102 E Hackamore St
Your Personal Tour Guide
Ask me questions while you tour the home.