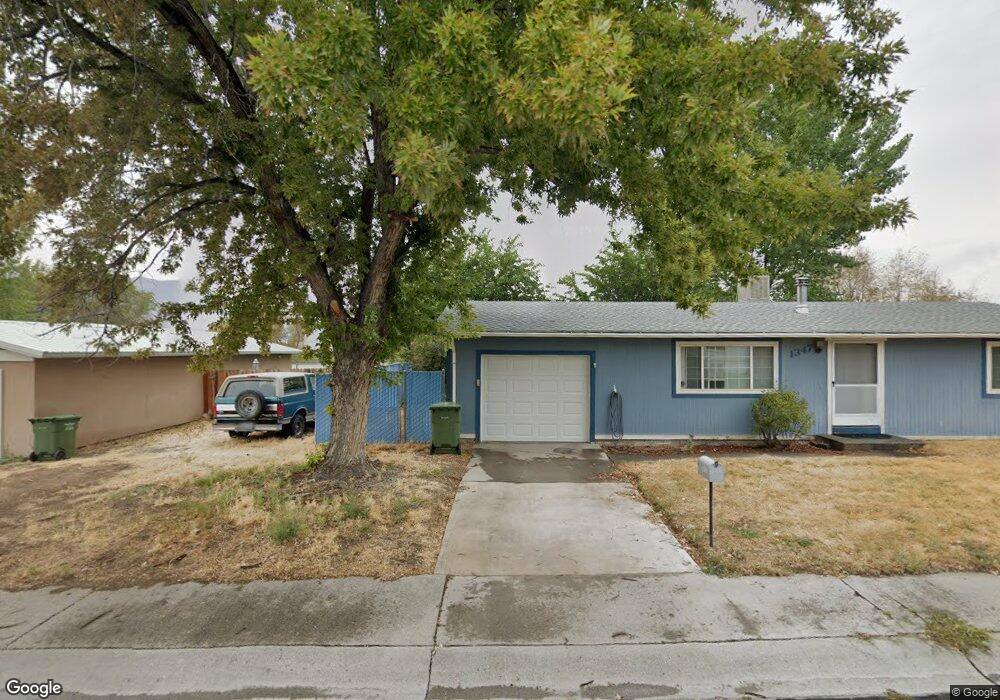
1341 Ocala Ave Winnemucca, NV 89445
Estimated Value: $250,293 - $281,000
2
Beds
1
Bath
912
Sq Ft
$298/Sq Ft
Est. Value
About This Home
This home is located at 1341 Ocala Ave, Winnemucca, NV 89445 and is currently estimated at $272,073, approximately $298 per square foot. 1341 Ocala Ave is a home located in Humboldt County with nearby schools including Sonoma Heights Elementary School, Winnemucca Junior High School, and French Ford Middle School.
Ownership History
Date
Name
Owned For
Owner Type
Purchase Details
Closed on
Jun 16, 2023
Sold by
Rudolf-Phillips Samara and Rudolf-Phillips Jeffrey Alan
Bought by
Phillips Jeffrey Alan
Current Estimated Value
Purchase Details
Closed on
Sep 24, 2021
Sold by
Twichell Doris A
Bought by
Rudolf Phillips Samara and Phillips Jeffrey
Home Financials for this Owner
Home Financials are based on the most recent Mortgage that was taken out on this home.
Original Mortgage
$181,649
Interest Rate
2.8%
Mortgage Type
FHA
Create a Home Valuation Report for This Property
The Home Valuation Report is an in-depth analysis detailing your home's value as well as a comparison with similar homes in the area
Home Values in the Area
Average Home Value in this Area
Purchase History
| Date | Buyer | Sale Price | Title Company |
|---|---|---|---|
| Phillips Jeffrey Alan | $66,419 | None Listed On Document | |
| Rudolf Phillips Samara | $185,000 | Stewart Title Company |
Source: Public Records
Mortgage History
| Date | Status | Borrower | Loan Amount |
|---|---|---|---|
| Previous Owner | Rudolf Phillips Samara | $181,649 |
Source: Public Records
Tax History Compared to Growth
Tax History
| Year | Tax Paid | Tax Assessment Tax Assessment Total Assessment is a certain percentage of the fair market value that is determined by local assessors to be the total taxable value of land and additions on the property. | Land | Improvement |
|---|---|---|---|---|
| 2025 | $842 | $25,737 | $9,800 | $15,937 |
| 2024 | $820 | $26,210 | $9,800 | $16,409 |
| 2023 | $820 | $23,247 | $7,525 | $15,722 |
| 2022 | $780 | $21,175 | $7,525 | $13,650 |
| 2021 | $786 | $21,377 | $7,525 | $13,852 |
| 2020 | $804 | $21,931 | $7,525 | $14,406 |
| 2019 | $796 | $21,698 | $7,525 | $14,173 |
| 2018 | $793 | $21,604 | $7,525 | $14,079 |
| 2017 | $801 | $21,844 | $7,525 | $14,319 |
| 2016 | $818 | $22,698 | $7,525 | $15,173 |
| 2015 | $833 | $22,755 | $7,525 | $15,230 |
| 2014 | $833 | $22,685 | $7,525 | $15,160 |
Source: Public Records
Map
Nearby Homes
- 502 Prebble St
- 3 Colado Ct
- 121 W Shepard St
- 134 W Shepard St
- 1385 S Bridge St
- 702 W Mcarthur Ave Unit 56
- 702 W Mcarthur Ave Unit 82
- 240 Circle Dr
- 0 Julie Ct
- 20 Julie Ct
- 540 Aiken St
- 16-0541-03 Walther Ln
- 539 S Bridge St
- 45 Julie Ct
- 609 Sheehan St
- 273 Mccoy St
- TBD E Haskell St
- 4180 Turner Ln
- 406 W 5th St
- 253 N Highland Dr