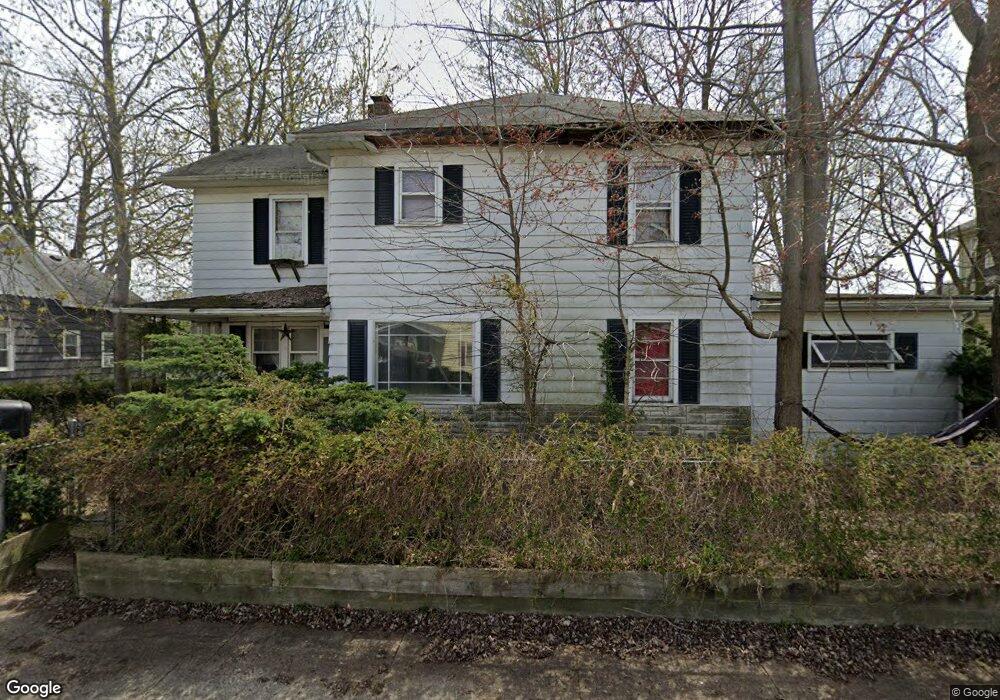
1341 S D St Elwood, IN 46036
Estimated Value: $111,000 - $159,000
2
Beds
2
Baths
2,156
Sq Ft
$62/Sq Ft
Est. Value
About This Home
This home is located at 1341 S D St, Elwood, IN 46036 and is currently estimated at $133,708, approximately $62 per square foot. 1341 S D St is a home located in Madison County with nearby schools including Elwood Elementary School, Elwood Intermediate School, and Elwood Junior-Senior High School.
Ownership History
Date
Name
Owned For
Owner Type
Purchase Details
Closed on
Feb 24, 2017
Sold by
Lamasco Redevelopment Llc
Bought by
1341 Trust
Current Estimated Value
Purchase Details
Closed on
Feb 1, 2017
Sold by
Madison County Auditor
Bought by
Lamasco Redevelopment Llc
Purchase Details
Closed on
Aug 31, 2006
Sold by
Gritt Martini J and Gritt Evelyn J
Bought by
Lee Elva and Bailey Jacque E
Home Financials for this Owner
Home Financials are based on the most recent Mortgage that was taken out on this home.
Original Mortgage
$66,500
Interest Rate
6.77%
Mortgage Type
New Conventional
Create a Home Valuation Report for This Property
The Home Valuation Report is an in-depth analysis detailing your home's value as well as a comparison with similar homes in the area
Home Values in the Area
Average Home Value in this Area
Purchase History
| Date | Buyer | Sale Price | Title Company |
|---|---|---|---|
| 1341 Trust | $3,400 | -- | |
| South D St Land Trust | $3,418 | Village Real Estate Co | |
| Lamasco Redevelopment Llc | $3,418 | United Tax Sale Services | |
| Lee Elva | -- | -- |
Source: Public Records
Mortgage History
| Date | Status | Borrower | Loan Amount |
|---|---|---|---|
| Previous Owner | Lee Elva | $66,500 |
Source: Public Records
Tax History Compared to Growth
Tax History
| Year | Tax Paid | Tax Assessment Tax Assessment Total Assessment is a certain percentage of the fair market value that is determined by local assessors to be the total taxable value of land and additions on the property. | Land | Improvement |
|---|---|---|---|---|
| 2024 | $600 | $60,000 | $11,800 | $48,200 |
| 2023 | $552 | $55,200 | $11,200 | $44,000 |
| 2022 | $559 | $54,900 | $10,600 | $44,300 |
| 2021 | $509 | $50,900 | $10,600 | $40,300 |
| 2020 | $496 | $48,600 | $10,100 | $38,500 |
| 2019 | $485 | $47,500 | $10,100 | $37,400 |
| 2018 | $959 | $45,000 | $10,100 | $34,900 |
| 2017 | $444 | $44,400 | $10,100 | $34,300 |
| 2016 | $2,478 | $58,500 | $10,100 | $48,400 |
| 2014 | $1,158 | $57,900 | $10,100 | $47,800 |
| 2013 | $1,158 | $57,900 | $10,100 | $47,800 |
Source: Public Records
Map
Nearby Homes