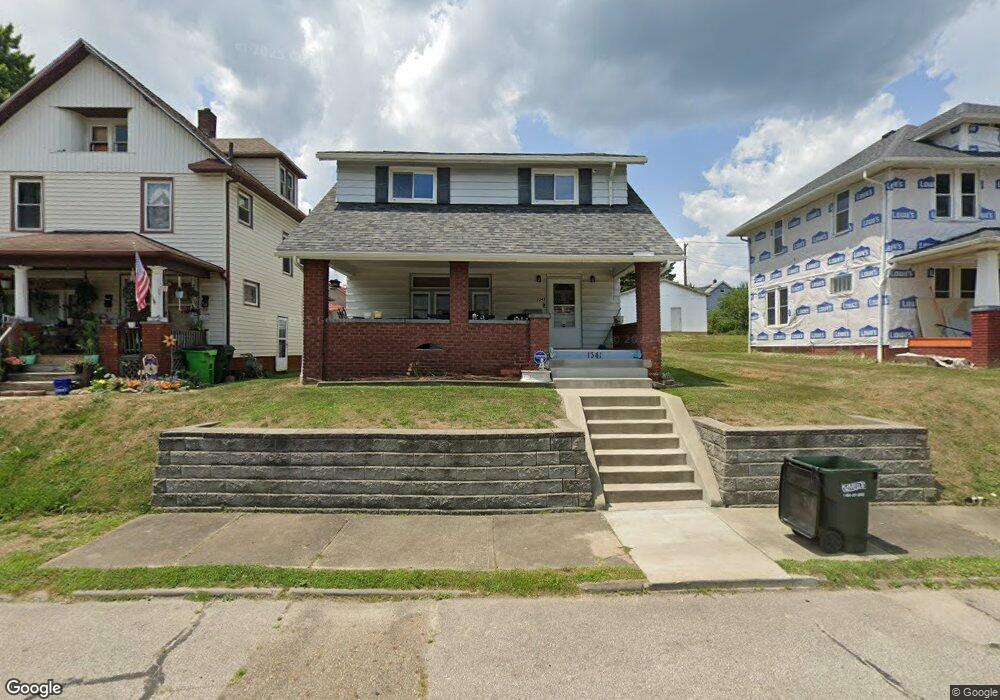
1341 S Seneca Ave Alliance, OH 44601
Estimated Value: $99,000 - $142,000
3
Beds
1
Bath
1,404
Sq Ft
$80/Sq Ft
Est. Value
About This Home
This home is located at 1341 S Seneca Ave, Alliance, OH 44601 and is currently estimated at $112,445, approximately $80 per square foot. 1341 S Seneca Ave is a home located in Stark County with nearby schools including Alliance Elementary School at Rockhill, Alliance Intermediate School at Northside, and Alliance Middle School.
Ownership History
Date
Name
Owned For
Owner Type
Purchase Details
Closed on
Dec 20, 2021
Sold by
Lanning Larry W
Bought by
Lanning Tammy L
Current Estimated Value
Purchase Details
Closed on
Nov 1, 2006
Sold by
Sartor Carl
Bought by
Lanning Larry W and Lanning Tammy L
Home Financials for this Owner
Home Financials are based on the most recent Mortgage that was taken out on this home.
Original Mortgage
$73,739
Outstanding Balance
$44,203
Interest Rate
6.45%
Mortgage Type
FHA
Estimated Equity
$68,242
Purchase Details
Closed on
Apr 7, 2005
Sold by
Abn Amro Mortgage Group Inc
Bought by
Sartor Carl
Purchase Details
Closed on
Mar 9, 2005
Sold by
Helsel Christina L
Bought by
Abn Amro Mortgage Group Inc
Purchase Details
Closed on
Nov 18, 2002
Sold by
Warner Susan M and Warner Craig L
Bought by
Helsel Christina L
Home Financials for this Owner
Home Financials are based on the most recent Mortgage that was taken out on this home.
Original Mortgage
$52,455
Interest Rate
6.1%
Mortgage Type
FHA
Purchase Details
Closed on
Apr 14, 1989
Create a Home Valuation Report for This Property
The Home Valuation Report is an in-depth analysis detailing your home's value as well as a comparison with similar homes in the area
Home Values in the Area
Average Home Value in this Area
Purchase History
| Date | Buyer | Sale Price | Title Company |
|---|---|---|---|
| Lanning Tammy L | -- | None Available | |
| Lanning Larry W | $74,900 | None Available | |
| Sartor Carl | $16,700 | Resource Title Agency Inc | |
| Abn Amro Mortgage Group Inc | $38,000 | Resource Title Agency Inc | |
| Helsel Christina L | $54,400 | Netwide Title Agency | |
| -- | $20,000 | -- |
Source: Public Records
Mortgage History
| Date | Status | Borrower | Loan Amount |
|---|---|---|---|
| Open | Lanning Larry W | $73,739 | |
| Previous Owner | Helsel Christina L | $52,455 |
Source: Public Records
Tax History Compared to Growth
Tax History
| Year | Tax Paid | Tax Assessment Tax Assessment Total Assessment is a certain percentage of the fair market value that is determined by local assessors to be the total taxable value of land and additions on the property. | Land | Improvement |
|---|---|---|---|---|
| 2025 | -- | $25,660 | $3,640 | $22,020 |
| 2024 | -- | $25,660 | $3,640 | $22,020 |
| 2023 | $640 | $15,930 | $3,470 | $12,460 |
| 2022 | $644 | $15,930 | $3,470 | $12,460 |
| 2021 | $296 | $16,070 | $3,470 | $12,600 |
| 2020 | $221 | $13,790 | $3,010 | $10,780 |
| 2019 | $218 | $13,790 | $3,010 | $10,780 |
| 2018 | $219 | $13,790 | $3,010 | $10,780 |
| 2017 | $183 | $12,850 | $2,520 | $10,330 |
| 2016 | $184 | $12,850 | $2,520 | $10,330 |
| 2015 | $64 | $10,190 | $2,520 | $7,670 |
| 2014 | $93 | $10,750 | $2,660 | $8,090 |
| 2013 | $47 | $10,750 | $2,660 | $8,090 |
Source: Public Records
Map
Nearby Homes
- 551 South St
- 1175 S Freedom Ave
- 729 Waugh St
- 1395 S Webb Ave
- 1044 S Liberty Ave
- 1005 S Freedom Ave
- 1437 S Linden Ave
- 815 Grace St
- 814 Milner St
- 1233 Woodland Ave
- 390 E College St
- 1475 Chatauqua Ct
- 831 Wade Ave
- 452 E Summit St
- 1846 S Freedom Ave
- 112 E College St
- 807 S Union Ave
- 317 E State St
- 442 S Liberty Ave
- 432 S Linden Ave
- 1351 S Seneca Ave
- 1333 S Seneca Ave
- 1361 S Seneca Ave
- 1321 S Seneca Ave
- 1365 S Seneca Ave
- 1360 S Seneca Ave
- 1385 S Seneca Ave
- 1344 S Freedom Ave
- 559 St
- 1350 S Freedom Ave
- 1332 S Freedom Ave
- 559 South St
- 539 South St
- 1334 S Seneca Ave
- 1336 S Seneca Ave
- 557 South St
- 1360 S Freedom Ave
- 1324 S Freedom Ave
- 1322 S Seneca Ave
- 1314 S Seneca Ave