Estimated Value: $167,000 - $239,144
4
Beds
2
Baths
1,873
Sq Ft
$109/Sq Ft
Est. Value
About This Home
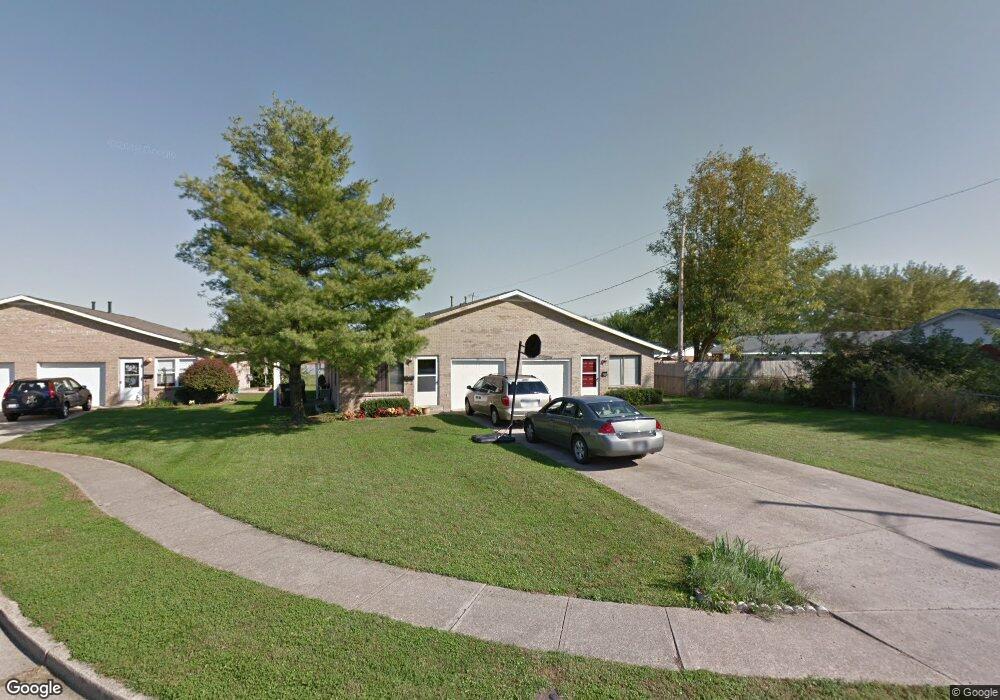
This home is located at 1341 Seneca Dr, Xenia, OH 45385 and is currently estimated at $204,536, approximately $109 per square foot. 1341 Seneca Dr is a home located in Greene County with nearby schools including Xenia High School, Summit Academy Community School for Alternative Learners - Xenia, and Legacy Christian Academy.
Ownership History
Date
Name
Owned For
Owner Type
Purchase Details
Closed on
Jul 7, 2021
Sold by
Loxley Daniel L and Loxley Sherry L
Bought by
B & E Residential Properties Llc
Current Estimated Value
Home Financials for this Owner
Home Financials are based on the most recent Mortgage that was taken out on this home.
Original Mortgage
$119,200
Outstanding Balance
$108,205
Interest Rate
2.93%
Mortgage Type
Commercial
Estimated Equity
$96,331
Purchase Details
Closed on
Mar 24, 2002
Sold by
Wooley Richard M and Wooley Jill L
Bought by
Loxley Daniel L
Home Financials for this Owner
Home Financials are based on the most recent Mortgage that was taken out on this home.
Original Mortgage
$96,750
Interest Rate
6.93%
Mortgage Type
Commercial
Purchase Details
Closed on
Jan 11, 1995
Sold by
Wickline Andrew D
Bought by
Wooley Richard M and Wooley Jill
Home Financials for this Owner
Home Financials are based on the most recent Mortgage that was taken out on this home.
Original Mortgage
$89,900
Interest Rate
9.23%
Mortgage Type
New Conventional
Create a Home Valuation Report for This Property
The Home Valuation Report is an in-depth analysis detailing your home's value as well as a comparison with similar homes in the area
Home Values in the Area
Average Home Value in this Area
Purchase History
| Date | Buyer | Sale Price | Title Company |
|---|---|---|---|
| B & E Residential Properties Llc | $149,000 | None Available | |
| Loxley Daniel L | $107,500 | -- | |
| Wooley Richard M | $99,900 | -- |
Source: Public Records
Mortgage History
| Date | Status | Borrower | Loan Amount |
|---|---|---|---|
| Open | B & E Residential Properties Llc | $119,200 | |
| Previous Owner | Loxley Daniel L | $96,750 | |
| Previous Owner | Wooley Richard M | $89,900 |
Source: Public Records
Tax History Compared to Growth
Tax History
| Year | Tax Paid | Tax Assessment Tax Assessment Total Assessment is a certain percentage of the fair market value that is determined by local assessors to be the total taxable value of land and additions on the property. | Land | Improvement |
|---|---|---|---|---|
| 2024 | $3,133 | $73,210 | $13,320 | $59,890 |
| 2023 | $3,133 | $73,210 | $13,320 | $59,890 |
| 2022 | $2,638 | $52,590 | $7,830 | $44,760 |
| 2021 | $2,674 | $52,590 | $7,830 | $44,760 |
| 2020 | $2,562 | $52,590 | $7,830 | $44,760 |
| 2019 | $2,370 | $45,810 | $7,390 | $38,420 |
| 2018 | $2,380 | $45,810 | $7,390 | $38,420 |
| 2017 | $2,311 | $45,810 | $7,390 | $38,420 |
| 2016 | $2,168 | $40,960 | $7,390 | $33,570 |
| 2015 | $2,174 | $40,960 | $7,390 | $33,570 |
| 2014 | $2,082 | $40,960 | $7,390 | $33,570 |
Source: Public Records
Map
Nearby Homes
- 1568 Cheyenne Dr
- 1618 Navajo Dr
- 1653 Seneca Dr
- 2758 Wyoming Dr
- 1144 Rockwell Dr
- 161 Montana Dr
- 121 S Progress Dr
- 219 Kansas Dr
- 1778 Arapaho Dr
- 1342 Kylemore Dr
- 1769 Gayhart Dr
- 1403 Texas Dr
- 1391 June Dr
- 414 Whisper Ln
- 1829 Gayhart Dr
- 1208 Bellbrook Ave
- 2142 Michigan Dr
- 1272 Bellbrook Ave
- 1283 June Dr
- 1233 June Dr
- 1341 Seneca Dr Unit 1343
- 1341 Seneca Dr Unit 1341-1343
- 1594 Cheyenne Dr
- 1333 Seneca Dr
- 1349 Seneca Dr
- 1580 Cheyenne Dr
- 1325 Seneca Dr
- 1342 Seneca Dr
- 1334 Seneca Dr
- 1326 Seneca Dr
- 1350 Seneca Dr
- 1554 Cheyenne Dr
- 1591 Cheyenne Dr
- 1364 Seneca Dr
- 1385 Seneca Dr
- 1402 Oshaughnesy Dr
- 1540 Cheyenne Dr
- 1376 Seneca Dr
- 1539 Cheyenne Dr
- 1312 Ottawa Dr