13414 Gainesway Dr Cypress, TX 77429
Estimated Value: $668,000 - $721,000
4
Beds
5
Baths
4,002
Sq Ft
$172/Sq Ft
Est. Value
About This Home
This home is located at 13414 Gainesway Dr, Cypress, TX 77429 and is currently estimated at $689,121, approximately $172 per square foot. 13414 Gainesway Dr is a home located in Harris County with nearby schools including Hamilton Elementary School, Hamilton Middle School, and Cy-Fair High School.
Ownership History
Date
Name
Owned For
Owner Type
Purchase Details
Closed on
Oct 21, 2015
Sold by
Roberson Craig L and Roberson Sushilla C
Bought by
Madden Timothy H and Madden Karen C
Current Estimated Value
Home Financials for this Owner
Home Financials are based on the most recent Mortgage that was taken out on this home.
Original Mortgage
$200,000
Outstanding Balance
$157,784
Interest Rate
3.96%
Mortgage Type
New Conventional
Estimated Equity
$531,337
Purchase Details
Closed on
Apr 26, 2010
Sold by
Center Colleen J
Bought by
Roberson Craig L
Purchase Details
Closed on
Nov 23, 2009
Sold by
Center Gregory Thomas
Bought by
Center Colleen J
Purchase Details
Closed on
Jul 8, 1999
Sold by
Cannon Custom Homes Inc
Bought by
Center Gregory Thomas and Center Colleen J
Home Financials for this Owner
Home Financials are based on the most recent Mortgage that was taken out on this home.
Original Mortgage
$240,000
Interest Rate
7.21%
Create a Home Valuation Report for This Property
The Home Valuation Report is an in-depth analysis detailing your home's value as well as a comparison with similar homes in the area
Home Values in the Area
Average Home Value in this Area
Purchase History
| Date | Buyer | Sale Price | Title Company |
|---|---|---|---|
| Madden Timothy H | -- | Attorney | |
| Roberson Craig L | -- | Legacy Escrow & Title Agency | |
| Center Colleen J | -- | None Available | |
| Center Gregory Thomas | -- | Charter Title Company |
Source: Public Records
Mortgage History
| Date | Status | Borrower | Loan Amount |
|---|---|---|---|
| Open | Madden Timothy H | $200,000 | |
| Previous Owner | Center Gregory Thomas | $240,000 | |
| Closed | Center Colleen J | $0 |
Source: Public Records
Tax History Compared to Growth
Tax History
| Year | Tax Paid | Tax Assessment Tax Assessment Total Assessment is a certain percentage of the fair market value that is determined by local assessors to be the total taxable value of land and additions on the property. | Land | Improvement |
|---|---|---|---|---|
| 2025 | $8,460 | $635,479 | $119,681 | $515,798 |
| 2024 | $8,460 | $639,364 | $119,681 | $519,683 |
| 2023 | $8,460 | $615,340 | $119,681 | $495,659 |
| 2022 | $13,743 | $580,000 | $92,062 | $487,938 |
| 2021 | $13,054 | $451,138 | $92,062 | $359,076 |
| 2020 | $13,459 | $450,251 | $65,594 | $384,657 |
| 2019 | $14,192 | $459,419 | $65,594 | $393,825 |
| 2018 | $4,905 | $457,000 | $65,594 | $391,406 |
| 2017 | $14,142 | $457,000 | $65,594 | $391,406 |
| 2016 | $14,116 | $456,139 | $65,594 | $390,545 |
| 2015 | $13,640 | $452,868 | $65,594 | $387,274 |
| 2014 | $13,640 | $439,386 | $65,594 | $373,792 |
Source: Public Records
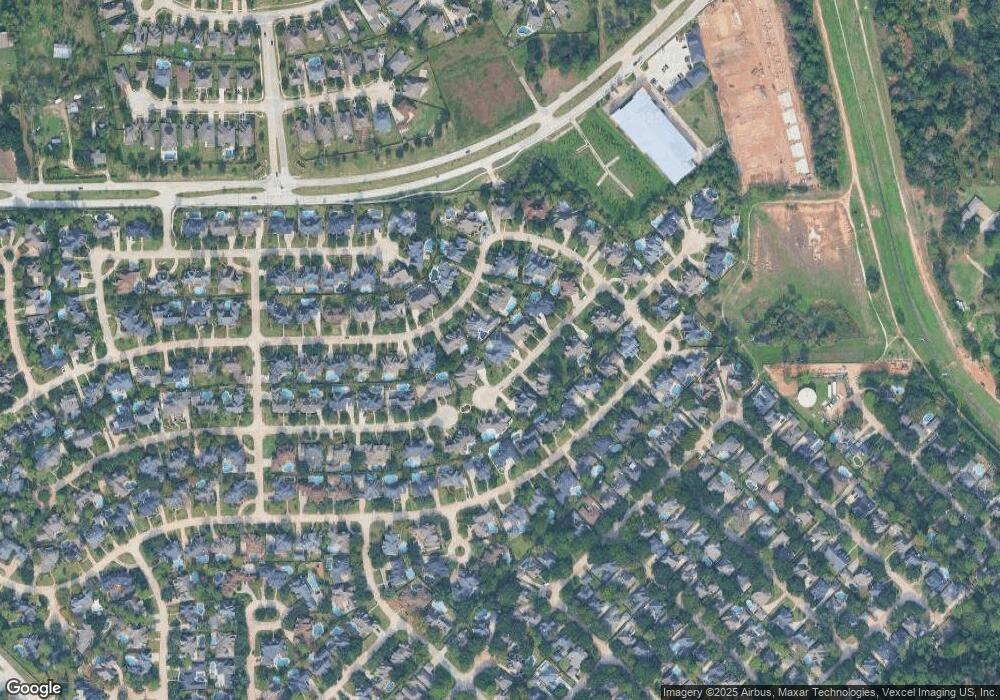
Map
Nearby Homes
- 13503 Copeland Oaks Blvd
- 13307 Cypress Pond Dr
- 13614 Gainesway Dr
- 13119 Rosewood Glen Dr
- 13915 Springmint Dr
- 13210 Chriswood Dr
- 13718 Gainesway Dr
- 12943 Spring Cypress Rd
- 13012 Kathy Ln
- 13710 Brahman Valley Ct
- 13730 Brahman Valley Ct
- 14018 Fair Glade Ln
- 14311 Lakepointe Bend Ln
- 13114 Kathy Ln
- 13731 Pedernales Ct
- 14210 Archer County Trail
- 12810 Wondering Forest Dr
- 14039 Fairwood Breeze
- 14418 Cobalt Bend Trail
- 13507 Marble Pointe Ln
- 13410 Gainesway Dr
- 13422 Gainesway Dr
- 13411 Copeland Oaks Blvd
- 13415 Copeland Oaks Blvd
- 13415 Gainesway Dr
- 13419 Gainesway Dr
- 13406 Gainesway Dr
- 13423 Gainesway Dr
- 13419 Copeland Oaks Blvd
- 13502 Gainesway Dr
- 13407 Gainesway Dr
- 13731 Vinery Ln
- 13402 Cypress Pond Dr
- 13406 Copeland Oaks Blvd
- 13414 Copeland Oaks Blvd
- 13723 Vinery Ln
- 13719 Vinery Ln
- 13314 Cypress Pond Dr
- 13406 Cypress Pond Dr
- 13503 Gainesway Dr