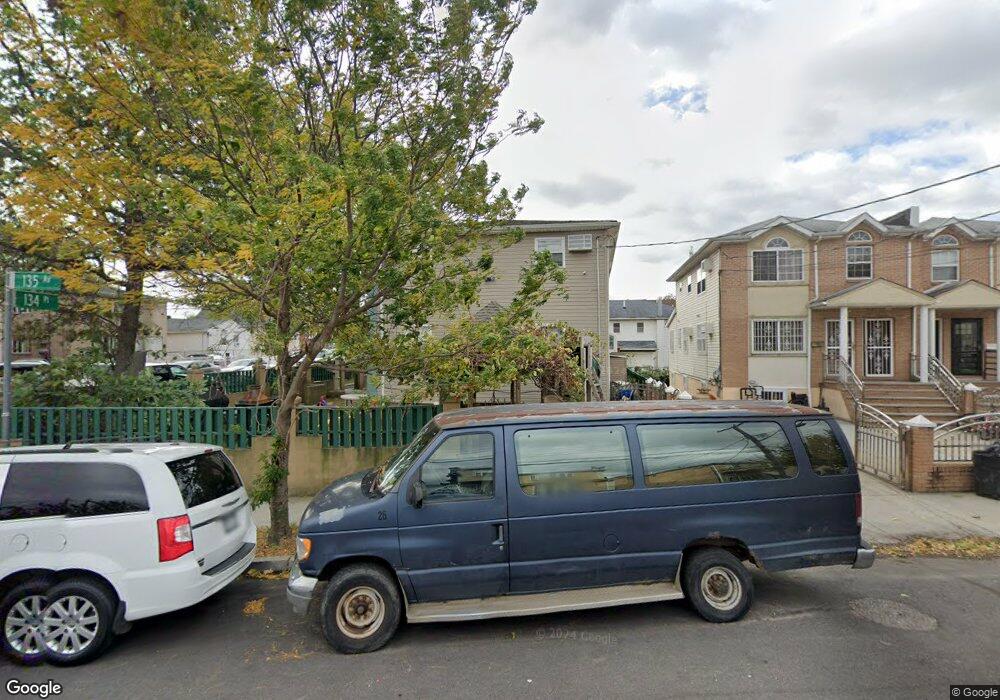
13418 135th Ave South Ozone Park, NY 11420
South Ozone Park NeighborhoodEstimated Value: $1,068,000 - $1,386,000
--
Bed
--
Bath
2,376
Sq Ft
$497/Sq Ft
Est. Value
About This Home
This home is located at 13418 135th Ave, South Ozone Park, NY 11420 and is currently estimated at $1,180,722, approximately $496 per square foot. 13418 135th Ave is a home located in Queens County with nearby schools including Ps 124 Osmond A Church, J.H.S. 226 Virgil I. Grisson, and John Adams High School.
Ownership History
Date
Name
Owned For
Owner Type
Purchase Details
Closed on
Feb 24, 2017
Sold by
Mohamed Bibi Shaneza and Mohammed Jamal M
Bought by
Mohammed Jamal M and Mohammed Shaziela Ishak
Current Estimated Value
Purchase Details
Closed on
Oct 31, 2008
Sold by
Santiago Maria I
Bought by
Giordano Mohamed Bibi Shaneza and Ishak Shaziela
Home Financials for this Owner
Home Financials are based on the most recent Mortgage that was taken out on this home.
Original Mortgage
$300,000
Interest Rate
6.13%
Purchase Details
Closed on
Jun 20, 2000
Sold by
Myers Douglas and Myers Sonita
Bought by
Santiago Maria Ivette
Home Financials for this Owner
Home Financials are based on the most recent Mortgage that was taken out on this home.
Original Mortgage
$140,750
Interest Rate
8.18%
Mortgage Type
FHA
Create a Home Valuation Report for This Property
The Home Valuation Report is an in-depth analysis detailing your home's value as well as a comparison with similar homes in the area
Home Values in the Area
Average Home Value in this Area
Purchase History
| Date | Buyer | Sale Price | Title Company |
|---|---|---|---|
| Mohammed Jamal M | -- | -- | |
| Giordano Mohamed Bibi Shaneza | $360,000 | -- | |
| Giordano Mohamed Bibi Shaneza | $360,000 | -- | |
| Santiago Maria Ivette | $142,000 | -- | |
| Santiago Maria Ivette | $142,000 | -- |
Source: Public Records
Mortgage History
| Date | Status | Borrower | Loan Amount |
|---|---|---|---|
| Previous Owner | Giordano Mohamed Bibi Shaneza | $300,000 | |
| Previous Owner | Santiago Maria Ivette | $140,750 |
Source: Public Records
Tax History Compared to Growth
Tax History
| Year | Tax Paid | Tax Assessment Tax Assessment Total Assessment is a certain percentage of the fair market value that is determined by local assessors to be the total taxable value of land and additions on the property. | Land | Improvement |
|---|---|---|---|---|
| 2025 | $7,457 | $38,759 | $10,685 | $28,074 |
| 2024 | $7,457 | $37,129 | $11,441 | $25,688 |
| 2023 | $7,035 | $35,028 | $10,435 | $24,593 |
| 2022 | $6,597 | $55,380 | $18,840 | $36,540 |
| 2021 | $6,834 | $45,900 | $18,840 | $27,060 |
| 2020 | $6,834 | $47,940 | $18,840 | $29,100 |
| 2019 | $6,473 | $47,580 | $18,840 | $28,740 |
| 2018 | $5,950 | $29,190 | $16,426 | $12,764 |
| 2017 | $5,314 | $27,538 | $18,166 | $9,372 |
| 2016 | $5,100 | $27,538 | $18,166 | $9,372 |
| 2015 | $1,087 | $26,916 | $19,652 | $7,264 |
| 2014 | $1,087 | $26,419 | $17,397 | $9,022 |
Source: Public Records
Map
Nearby Homes
- 13327 135th Place
- 133-12 133rd St
- 13121 133rd St
- 131-10 134th St
- 129-55 134th St
- 132-01 131st Ave
- 12940 135th St
- 129-28 135th Place
- 129-14 135th Ave
- 131-15 130th St
- 13410 Sutter Ave
- 129-13 135th Place
- 137-04 130th Ave
- 13116 140th St
- 130-16 130th St
- 13013 Sutter Ave
- 14207 135th Ave
- 13111 142nd St
- 13015 129th St
- 135-40 Alwick Rd
- 13416 135th Ave
- 134-14 135th Ave Unit 134-14 135th Avenue
- 134-14 135th Ave
- 13414 135th Ave
- 13414 135th Ave Unit 1st Floor
- 13414 135th Ave
- 13414 135th Ave
- 13510 134th Place
- 13408 135th Ave
- 134-28 135th Ave
- 13428 135th Ave
- 13406 135th Ave
- 13509 134th Place
- 13516 134th Place Unit 3090560
- 13515 134th St
- 135-16 134th Place
- 13515 134th Place
- 13411 135th Ave
- 13434 135th Ave
- 13417 135th Ave