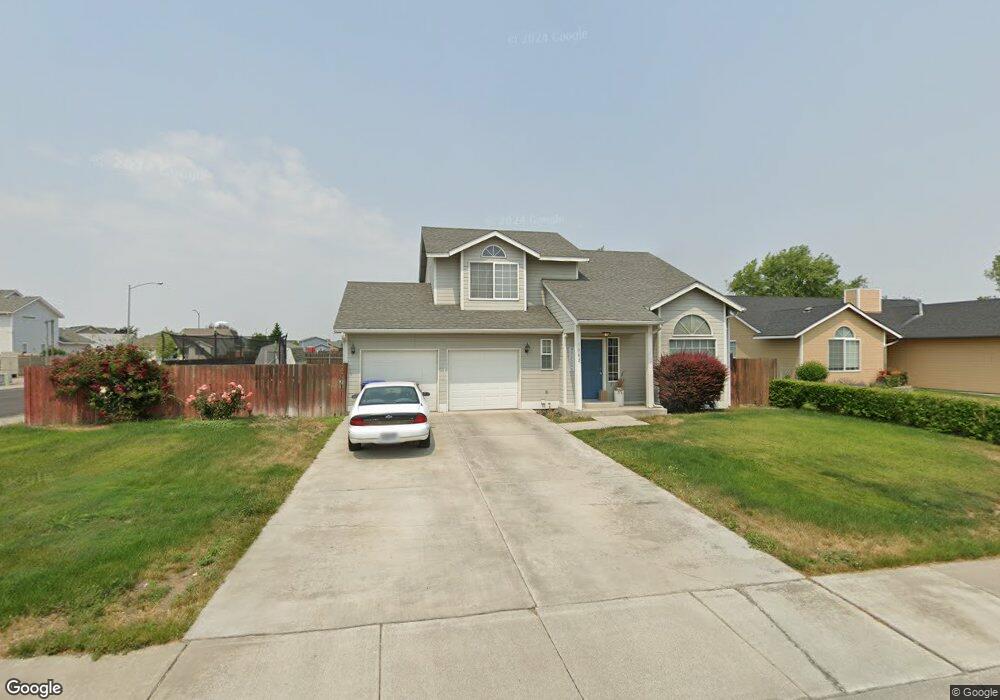
1342 E Sandpiper Cir Moses Lake, WA 98837
Estimated Value: $295,077 - $357,000
3
Beds
3
Baths
1,283
Sq Ft
$254/Sq Ft
Est. Value
About This Home
This home is located at 1342 E Sandpiper Cir, Moses Lake, WA 98837 and is currently estimated at $325,769, approximately $253 per square foot. 1342 E Sandpiper Cir is a home located in Grant County with nearby schools including Lakeview Terrace Elementary School, Columbia Middle School, and Moses Lake High School.
Ownership History
Date
Name
Owned For
Owner Type
Purchase Details
Closed on
Jul 16, 2009
Sold by
Willoughby Mark and Willoughby Susan R
Bought by
Mitchell Michael B
Current Estimated Value
Home Financials for this Owner
Home Financials are based on the most recent Mortgage that was taken out on this home.
Original Mortgage
$151,020
Outstanding Balance
$98,565
Interest Rate
5.31%
Mortgage Type
New Conventional
Estimated Equity
$227,204
Purchase Details
Closed on
May 19, 2005
Sold by
Rodriguez Alejandra and Adamos Alejandra
Bought by
Willoughby Mark and Willoughby Susan R
Home Financials for this Owner
Home Financials are based on the most recent Mortgage that was taken out on this home.
Original Mortgage
$101,600
Interest Rate
5.87%
Mortgage Type
Fannie Mae Freddie Mac
Create a Home Valuation Report for This Property
The Home Valuation Report is an in-depth analysis detailing your home's value as well as a comparison with similar homes in the area
Home Values in the Area
Average Home Value in this Area
Purchase History
| Date | Buyer | Sale Price | Title Company |
|---|---|---|---|
| Mitchell Michael B | $148,000 | Frontier Title | |
| Willoughby Mark | $127,000 | Chicago Title Ins Co |
Source: Public Records
Mortgage History
| Date | Status | Borrower | Loan Amount |
|---|---|---|---|
| Open | Mitchell Michael B | $151,020 | |
| Previous Owner | Willoughby Mark | $101,600 |
Source: Public Records
Tax History Compared to Growth
Tax History
| Year | Tax Paid | Tax Assessment Tax Assessment Total Assessment is a certain percentage of the fair market value that is determined by local assessors to be the total taxable value of land and additions on the property. | Land | Improvement |
|---|---|---|---|---|
| 2024 | $2,238 | $192,370 | $44,500 | $147,870 |
| 2023 | $2,335 | $188,295 | $32,500 | $155,795 |
| 2022 | $2,277 | $188,295 | $32,500 | $155,795 |
| 2021 | $2,243 | $188,295 | $32,500 | $155,795 |
| 2020 | $2,061 | $179,800 | $32,500 | $147,300 |
| 2019 | $1,900 | $137,675 | $30,000 | $107,675 |
| 2018 | $2,308 | $145,810 | $30,000 | $115,810 |
| 2017 | $1,852 | $126,510 | $30,000 | $96,510 |
| 2016 | $1,829 | $124,435 | $30,000 | $94,435 |
| 2013 | -- | $120,500 | $30,000 | $90,500 |
Source: Public Records
Map
Nearby Homes
- 1346 E Oasis Cir
- 1059 July Ct
- 1055 July Ct
- 1221 S Lakeland Dr
- 1042 S Lakeland Dr
- 1346 Greens Loop
- 1001 E Hayden Dr
- 941 E Hayden Dr
- 1311 S Vandal Ct
- 814 S Blessing St
- 927 E Cherry Ave
- 1412 E Hunter Place
- 736 S Rees St
- 805 S Hamilton Rd
- 840 S Grand Dr
- 800 S Hamilton Rd
- 2299 Admiral Rd NE
- 2351 Admiral Rd NE
- 732 N Widgeon St
- 720 N Widgeon St
- 1149 S Lakeland Dr
- 1346 E Sandpiper Cir
- 1343 Yost Cir NE
- 1347 Yost Cir NE
- 1350 E Sandpiper Cir
- 1343 E Sandpiper Cir
- 1339 Yost Cir NE
- 1351 Yost Cir NE
- 1347 E Sandpiper Cir
- 1354 E Sandpiper Cir
- 1351 E Sandpiper Cir
- 1355 Yost Cir NE
- 1355 Yost Cir NE
- 1335 Yost Cir NE
- 1355 E Sandpiper Cir
- 1342 Yost Cir NE
- 1342 E Oasis Cir
- 1358 E Sandpiper Cir
- 1346 Yost Cir NE
- 1359 Yost Cir NE