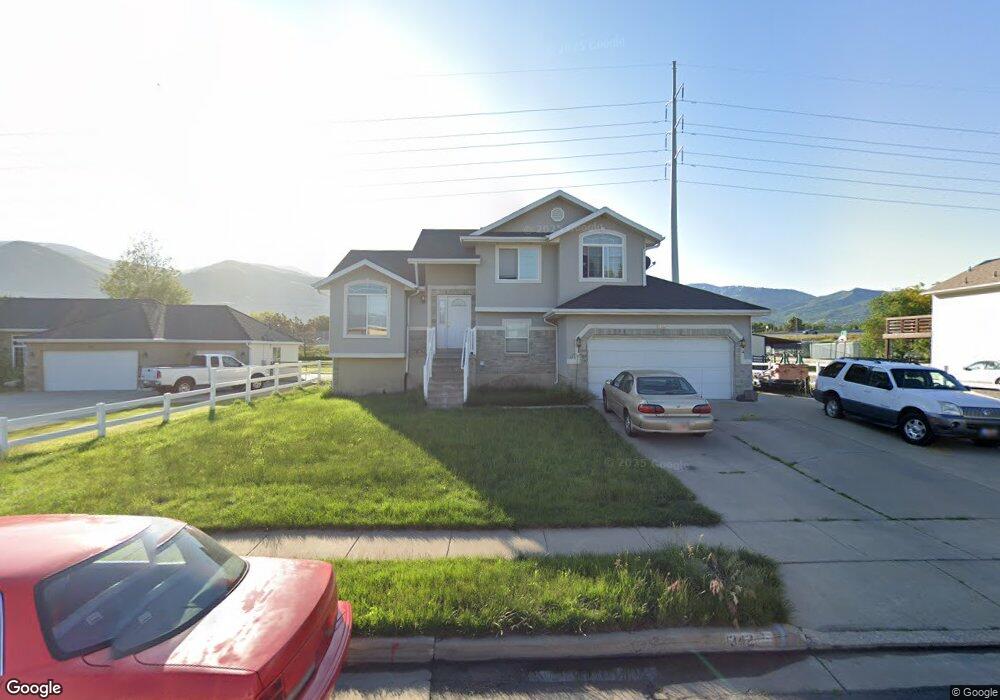
1342 N 550 W West Bountiful, UT 84087
Estimated Value: $523,000 - $642,000
3
Beds
3
Baths
1,660
Sq Ft
$346/Sq Ft
Est. Value
About This Home
This home is located at 1342 N 550 W, West Bountiful, UT 84087 and is currently estimated at $574,620, approximately $346 per square foot. 1342 N 550 W is a home located in Davis County with nearby schools including West Bountiful Elementary School, Bountiful Junior High School, and Viewmont High School.
Ownership History
Date
Name
Owned For
Owner Type
Purchase Details
Closed on
Nov 21, 1997
Sold by
M Y Enterprises Inc
Bought by
Taylor Chad M
Current Estimated Value
Home Financials for this Owner
Home Financials are based on the most recent Mortgage that was taken out on this home.
Original Mortgage
$150,000
Outstanding Balance
$24,509
Interest Rate
7.23%
Estimated Equity
$550,111
Purchase Details
Closed on
Dec 2, 1996
Sold by
M Y Enterprises Inc
Bought by
South Davis County Sewer Improvement Dis
Create a Home Valuation Report for This Property
The Home Valuation Report is an in-depth analysis detailing your home's value as well as a comparison with similar homes in the area
Home Values in the Area
Average Home Value in this Area
Purchase History
| Date | Buyer | Sale Price | Title Company |
|---|---|---|---|
| Taylor Chad M | -- | Associated Title Company | |
| South Davis County Sewer Improvement Dis | -- | -- |
Source: Public Records
Mortgage History
| Date | Status | Borrower | Loan Amount |
|---|---|---|---|
| Open | Taylor Chad M | $150,000 |
Source: Public Records
Tax History Compared to Growth
Tax History
| Year | Tax Paid | Tax Assessment Tax Assessment Total Assessment is a certain percentage of the fair market value that is determined by local assessors to be the total taxable value of land and additions on the property. | Land | Improvement |
|---|---|---|---|---|
| 2025 | $3,308 | $276,650 | $133,470 | $143,180 |
| 2024 | $3,089 | $265,650 | $110,802 | $154,848 |
| 2023 | $2,940 | $466,000 | $202,247 | $263,753 |
| 2022 | $3,035 | $264,550 | $102,917 | $161,633 |
| 2021 | $2,932 | $389,000 | $150,552 | $238,448 |
| 2020 | $2,796 | $342,000 | $130,427 | $211,573 |
| 2019 | $2,515 | $311,000 | $124,495 | $186,505 |
| 2018 | $2,250 | $287,000 | $114,425 | $172,575 |
| 2016 | $1,880 | $134,200 | $47,676 | $86,524 |
| 2015 | $1,868 | $119,735 | $47,676 | $72,059 |
| 2014 | $1,587 | $103,405 | $47,676 | $55,729 |
| 2013 | -- | $119,882 | $48,567 | $71,315 |
Source: Public Records
Map
Nearby Homes
- Lincoln Farmhouse Plan at Belmont Farms
- Belmont Traditional Plan at Belmont Farms
- Hampton Traditional Plan at Belmont Farms
- 366 W 1000 N
- 637 W 1600 N
- 1503 N 300 W
- 235 W 1400 N
- 790 N 500 W
- 1410 N 200 W
- 1194 N 200 W
- 1260 N 200 W
- 1552 N 200 W
- 825 W 1320 N
- 184 Park Shadows Cir
- 239 Lyman Ln
- 234 Leah Cir
- 810 Park Shadows Cir
- 204 Lyman Ln
- 553 N 200 W
- 548 S 675 W