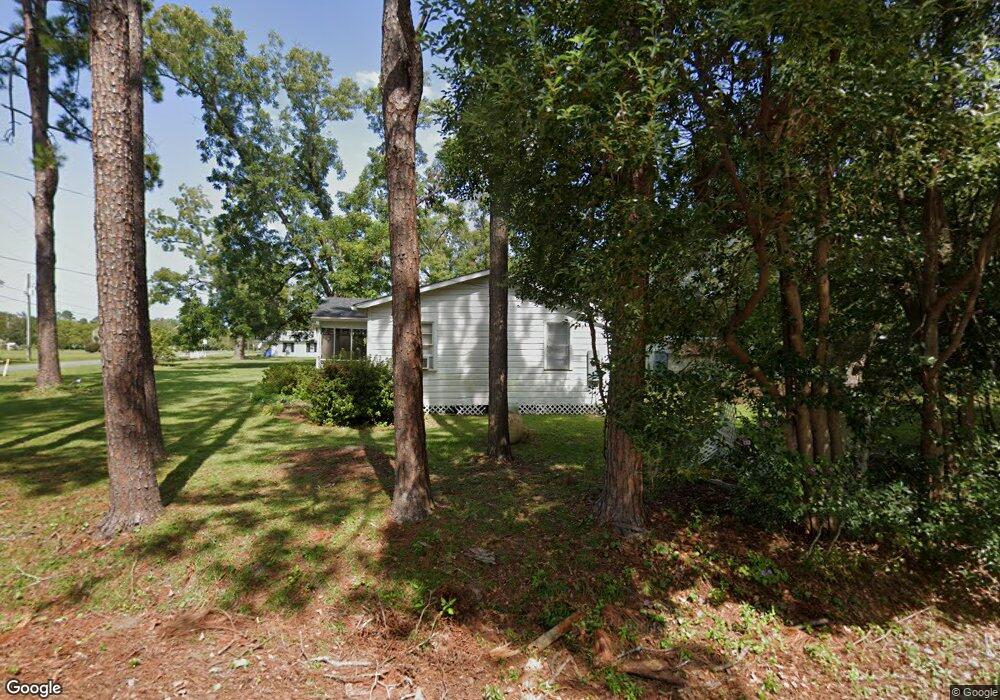
1342 Red Keen Rd Waycross, GA 31503
Estimated Value: $77,430 - $142,000
--
Bed
1
Bath
936
Sq Ft
$117/Sq Ft
Est. Value
About This Home
This home is located at 1342 Red Keen Rd, Waycross, GA 31503 and is currently estimated at $109,108, approximately $116 per square foot. 1342 Red Keen Rd is a home located in Ware County with nearby schools including Waresboro Elementary School, Ware County Middle School, and Ware County High School.
Create a Home Valuation Report for This Property
The Home Valuation Report is an in-depth analysis detailing your home's value as well as a comparison with similar homes in the area
Home Values in the Area
Average Home Value in this Area
Tax History Compared to Growth
Tax History
| Year | Tax Paid | Tax Assessment Tax Assessment Total Assessment is a certain percentage of the fair market value that is determined by local assessors to be the total taxable value of land and additions on the property. | Land | Improvement |
|---|---|---|---|---|
| 2024 | $535 | $21,205 | $8,280 | $12,925 |
| 2023 | $546 | $18,550 | $3,036 | $15,514 |
| 2022 | $536 | $18,550 | $3,036 | $15,514 |
| 2021 | $455 | $14,508 | $3,036 | $11,472 |
| 2020 | $447 | $14,101 | $3,036 | $11,065 |
| 2019 | $352 | $10,900 | $3,036 | $7,864 |
| 2018 | $344 | $10,529 | $3,036 | $7,493 |
| 2017 | $343 | $10,529 | $3,036 | $7,493 |
| 2016 | $343 | $10,529 | $3,036 | $7,493 |
| 2015 | $347 | $10,528 | $3,036 | $7,493 |
| 2014 | $346 | $10,529 | $3,036 | $7,493 |
| 2013 | -- | $10,528 | $3,036 | $7,492 |
Source: Public Records
Map
Nearby Homes
- 1238 Red Keen Rd
- 2836 Evergreen Rd
- 2867 Evergreen Rd
- 2885 Longwood Rd
- 850 Woodard Ln
- 2857 Cherokee St
- 1261 Lake St
- 1210 N Augusta Ave
- Lot 155 N Augusta Avenue Cherokee Ave
- 2117 Tamara Rd
- 1300 Stanton Ave
- 2066 Cherokee St
- 0 Anita South St
- 2869 Ben St
- 2879 Ben St
- 2885 Ben St
- 221 Sierra Ln
- 1953 State St
- 274 S Anita St
- 1601 Genoa St
- 2600 Lamar Avenue Extension
- 1286 Red Keen Rd
- 1285 Red Keen Rd
- 1311 Hendrix Dr
- 1349 Hendrix Dr
- 1372 Red Keen Rd
- 1215 Red Keen Rd
- 1214 Robin St
- 1353 Red Keen Rd
- 2625 Lamar Avenue Extension
- 2616 Lamar Avenue Extension
- 2578 Ben Hill Ave
- 1355 Hendrix Dr
- 1288 Lark St
- 2534 Lamar Avenue Extension
- 2568 Ben Hill Ave
- 1400 Red Keen Rd
- 2630 Lamar Avenue Extension
- 1354 Hendrix Dr
- 2533 Lamar Avenue Extension