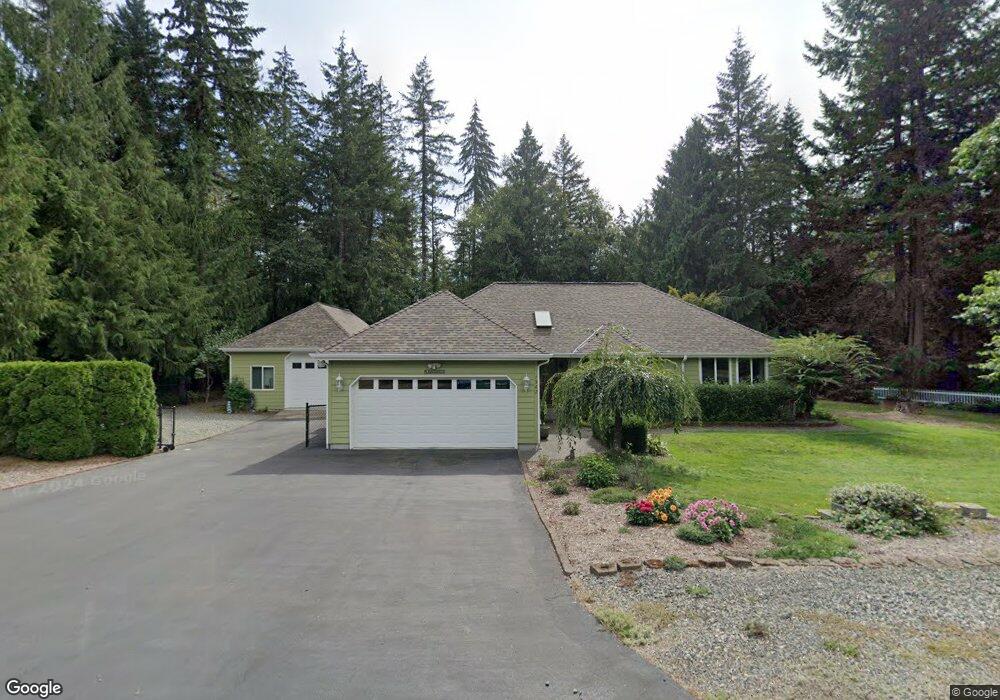
1342 SW Station Circle Rd Port Orchard, WA 98367
Estimated Value: $571,000 - $595,000
3
Beds
3
Baths
1,674
Sq Ft
$346/Sq Ft
Est. Value
About This Home
This home is located at 1342 SW Station Circle Rd, Port Orchard, WA 98367 and is currently estimated at $579,316, approximately $346 per square foot. 1342 SW Station Circle Rd is a home located in Kitsap County with nearby schools including Sidney Glen Elementary School, Cedar Heights Middle School, and South Kitsap High School.
Ownership History
Date
Name
Owned For
Owner Type
Purchase Details
Closed on
Aug 26, 1997
Sold by
Larson Barbara J
Bought by
Parkhurst Jack M and Parkhurst Marian E
Current Estimated Value
Home Financials for this Owner
Home Financials are based on the most recent Mortgage that was taken out on this home.
Original Mortgage
$127,900
Outstanding Balance
$18,215
Interest Rate
7.43%
Estimated Equity
$561,101
Purchase Details
Closed on
Dec 22, 1995
Sold by
Larson M O
Bought by
Larson Barbara J
Home Financials for this Owner
Home Financials are based on the most recent Mortgage that was taken out on this home.
Original Mortgage
$82,500
Interest Rate
7.36%
Create a Home Valuation Report for This Property
The Home Valuation Report is an in-depth analysis detailing your home's value as well as a comparison with similar homes in the area
Home Values in the Area
Average Home Value in this Area
Purchase History
| Date | Buyer | Sale Price | Title Company |
|---|---|---|---|
| Parkhurst Jack M | $150,500 | Transnation Title Insurance | |
| Larson Barbara J | $70,000 | Land Title Company |
Source: Public Records
Mortgage History
| Date | Status | Borrower | Loan Amount |
|---|---|---|---|
| Open | Parkhurst Jack M | $127,900 | |
| Previous Owner | Larson Barbara J | $82,500 |
Source: Public Records
Tax History Compared to Growth
Tax History
| Year | Tax Paid | Tax Assessment Tax Assessment Total Assessment is a certain percentage of the fair market value that is determined by local assessors to be the total taxable value of land and additions on the property. | Land | Improvement |
|---|---|---|---|---|
| 2026 | $4,390 | $501,000 | $86,280 | $414,720 |
| 2025 | $4,390 | $501,000 | $86,280 | $414,720 |
| 2024 | $4,257 | $501,000 | $86,280 | $414,720 |
| 2023 | $4,229 | $501,000 | $86,280 | $414,720 |
| 2022 | $4,072 | $403,930 | $68,770 | $335,160 |
| 2021 | $3,883 | $364,380 | $62,520 | $301,860 |
| 2020 | $3,991 | $364,310 | $61,330 | $302,980 |
| 2019 | $3,520 | $352,790 | $56,680 | $296,110 |
| 2018 | $3,894 | $297,730 | $48,780 | $248,950 |
| 2017 | $3,272 | $297,730 | $48,780 | $248,950 |
| 2016 | $3,191 | $265,590 | $46,460 | $219,130 |
| 2015 | $3,091 | $260,620 | $46,460 | $214,160 |
| 2014 | -- | $225,760 | $48,450 | $177,310 |
| 2013 | -- | $225,760 | $48,450 | $177,310 |
Source: Public Records
Map
Nearby Homes
- 7261 Fern Vista Place SW
- 0 SW Glenwood Rd Unit NWM2457669
- 700 SW Black Jack Ln
- 30 Acres Glenwood Rd SW
- Sherwood Plan at Stetson Heights
- Cambridge Plan at Stetson Heights
- Bristol Plan at Stetson Heights
- Berkshire Plan at Stetson Heights
- Hawthorne Plan at Stetson Heights
- Ballard Plan at Stetson Heights
- Bradford Plan at Stetson Heights
- 1123 SW Sedge St
- 5965 Waverly Rd SW
- 15081 Glenwood Rd SW
- 1081 SW Pendleton Way
- 8718 Sidney Rd SW
- 8840 Conwhit Ln SW
- 7139 SW Dunraven Ln
- 5230 Sidney Rd SW
- 7487 Bethel Burley Rd SE
- 0 LOT 3 SW Miller Rd
- 1334 SW Station Circle Rd
- 1350 SW Station Circle Rd
- 1337 SW Station Circle Rd
- 1347 SW Station Circle Rd
- 1010 SW Miller Rd
- 902 SW Miller Rd
- 7119 Hayward St SW
- 1358 SW Station Circle Rd
- 1326 SW Station Circle Rd
- 1357 SW Station Circle Rd
- 1317 SW Station Circle Rd
- 876 SW Miller Rd
- 1261 SW Station Circle Rd
- 1255 SW Station Circle Rd
- 1318 SW Station Circle Rd
- 0 XXX SW Sam Nichols St
- 0 XXX SW Sam Nichols St
- 1366 SW Station Circle Rd
- 1279 SW Station Circle Rd