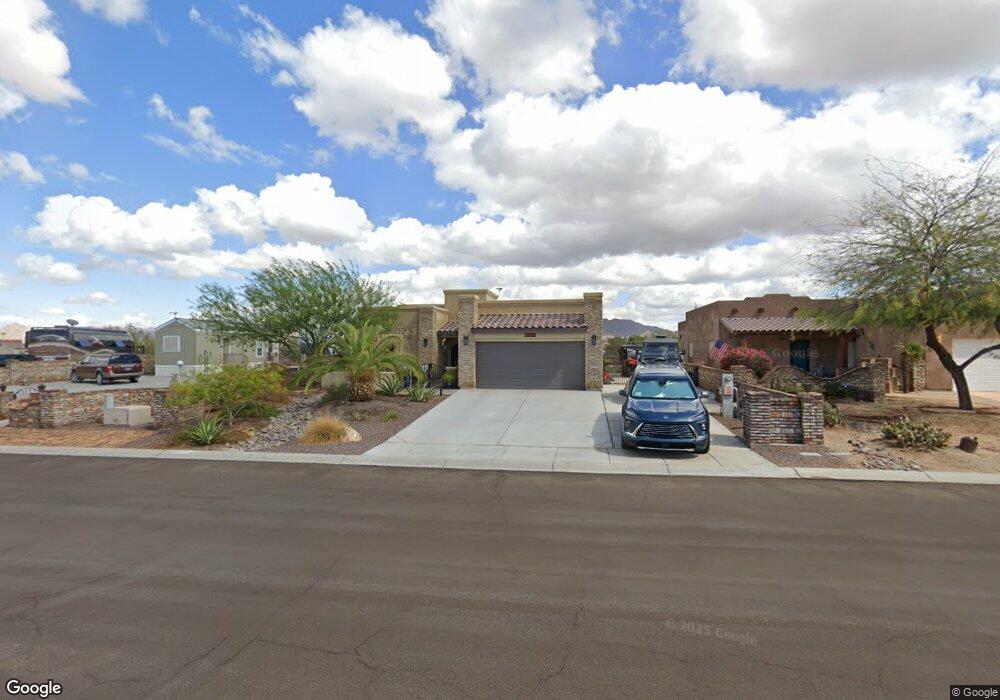
13423 S Onammi Ave Yuma, AZ 85367
Fortuna Foothills NeighborhoodEstimated Value: $397,000 - $423,000
2
Beds
2
Baths
1,535
Sq Ft
$267/Sq Ft
Est. Value
About This Home
This home is located at 13423 S Onammi Ave, Yuma, AZ 85367 and is currently estimated at $410,523, approximately $267 per square foot. 13423 S Onammi Ave is a home with nearby schools including Sunrise Elementary School, Ron Watson Middle School, and Gila Ridge High School.
Ownership History
Date
Name
Owned For
Owner Type
Purchase Details
Closed on
Jan 3, 2024
Sold by
Gridley Timothy W and Gridley Linda A
Bought by
Linda And Timothy Gridley Living Trust and Gridley
Current Estimated Value
Purchase Details
Closed on
Jun 20, 2018
Sold by
Benson Marilyn J
Bought by
Gridley Timothy W and Gridley Linda A
Purchase Details
Closed on
Sep 27, 2017
Sold by
Benson Marilyn and Benson Marilyn J
Bought by
Benson Marilyn J and Marilyn J Benson Living Trust
Purchase Details
Closed on
Mar 25, 2003
Sold by
Mohr Neil W and Mohr Judith A
Bought by
Benson Larry E and Benson Marilyn
Purchase Details
Closed on
Dec 26, 2002
Sold by
Yuma Title & Trust Co
Bought by
Mohr Neil W and Mohr Judith A
Home Financials for this Owner
Home Financials are based on the most recent Mortgage that was taken out on this home.
Original Mortgage
$32,165
Interest Rate
6.15%
Mortgage Type
Seller Take Back
Create a Home Valuation Report for This Property
The Home Valuation Report is an in-depth analysis detailing your home's value as well as a comparison with similar homes in the area
Home Values in the Area
Average Home Value in this Area
Purchase History
| Date | Buyer | Sale Price | Title Company |
|---|---|---|---|
| Linda And Timothy Gridley Living Trust | -- | None Listed On Document | |
| Gridley Timothy W | $74,000 | Pioneer Title Agencyinc | |
| Benson Marilyn J | -- | None Available | |
| Benson Larry E | $49,800 | -- | |
| Mohr Neil W | $37,165 | Yuma Title |
Source: Public Records
Mortgage History
| Date | Status | Borrower | Loan Amount |
|---|---|---|---|
| Previous Owner | Mohr Neil W | $32,165 |
Source: Public Records
Tax History Compared to Growth
Tax History
| Year | Tax Paid | Tax Assessment Tax Assessment Total Assessment is a certain percentage of the fair market value that is determined by local assessors to be the total taxable value of land and additions on the property. | Land | Improvement |
|---|---|---|---|---|
| 2025 | $2,360 | $24,801 | $6,178 | $18,623 |
| 2024 | $2,335 | $23,621 | $6,021 | $17,600 |
| 2023 | $2,335 | $22,496 | $5,249 | $17,247 |
| 2022 | $2,254 | $21,425 | $5,423 | $16,002 |
| 2021 | $2,379 | $20,405 | $4,923 | $15,482 |
| 2020 | $2,171 | $19,433 | $4,630 | $14,803 |
| 2019 | $586 | $5,058 | $4,900 | $158 |
| 2018 | $627 | $5,367 | $5,200 | $167 |
| 2017 | $737 | $5,367 | $5,200 | $167 |
| 2016 | $795 | $6,269 | $6,100 | $169 |
| 2015 | $691 | $6,254 | $6,100 | $154 |
| 2014 | $691 | $6,125 | $5,950 | $175 |
Source: Public Records
Map
Nearby Homes
- 14696 E 49th Dr
- 14563 E 51st Dr
- 14817 E 49th St
- 14369 E 50th St
- 14308 E 51st Dr
- 14445 E 53rd Dr
- 0000 Chase Way
- 14452 E 54th St
- 12858 S Drucilla Ln
- 13786 S Schechert Way
- 14442 E 54th St
- 14393 E 53rd Ln
- 14530 E 55th St
- 13310 S Chase Way
- 14484 E 55th Ln
- 13199 S Driftwood Dr
- 14158 E 49th Dr
- 13424 E 52nd Dr
- 13902 E 53rd Dr
- 13835 E 51 Ln
- 13429 S Onammi Ave
- 13409 Onammi Ave
- 13437 S Onammi Ave
- 13428 S Onammi Ave
- 13422 S Onammi Ave
- 13395 S Onammi Ave
- 13436 S Onammi Ave
- 13395 Onammi Ave
- 13444 S Onammi Ave
- 13391 Onammi Ave
- 13451 S Onammi Ave
- 13450 S Onammi Ave
- 14628 E 51st Dr
- 13461 Onammi Ave
- 13385 Onammi Ave
- 14640 E 51 Dr
- 14634 E 51 Dr
- 14618 E 51st Dr
- 13396 S Onammi Ave
- 13460 S Onammi Ave