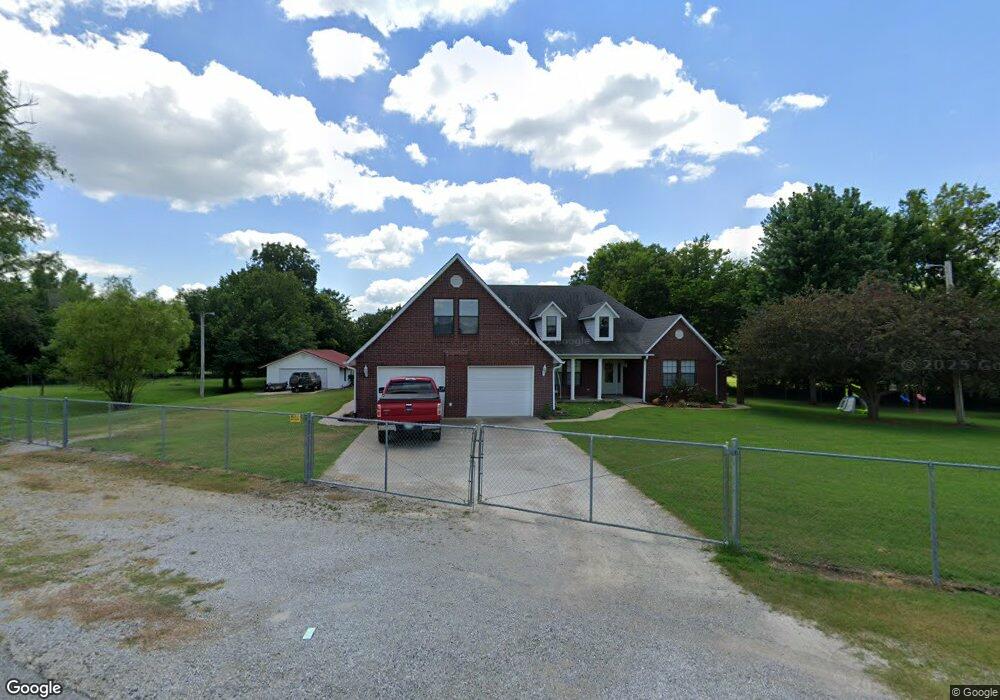
13424 E 463 Rd Claremore, OK 74017
Estimated Value: $371,000 - $453,000
4
Beds
3
Baths
2,335
Sq Ft
$169/Sq Ft
Est. Value
About This Home
This home is located at 13424 E 463 Rd, Claremore, OK 74017 and is currently estimated at $395,639, approximately $169 per square foot. 13424 E 463 Rd is a home with nearby schools including Sequoyah Elementary School and Sequoyah High School.
Ownership History
Date
Name
Owned For
Owner Type
Purchase Details
Closed on
Jun 26, 2020
Sold by
Radley William and Radley Brytnea S
Bought by
Radley William Jefferson and Radley Brytnea S
Current Estimated Value
Home Financials for this Owner
Home Financials are based on the most recent Mortgage that was taken out on this home.
Original Mortgage
$159,800
Outstanding Balance
$112,338
Interest Rate
3.2%
Mortgage Type
New Conventional
Estimated Equity
$283,301
Purchase Details
Closed on
Jun 7, 2016
Sold by
Guess Kenneth F and Estate Of Delbert C Guess And
Bought by
Radley William
Home Financials for this Owner
Home Financials are based on the most recent Mortgage that was taken out on this home.
Original Mortgage
$201,600
Interest Rate
3.66%
Mortgage Type
New Conventional
Purchase Details
Closed on
Mar 28, 1997
Sold by
Flynn Huey I
Bought by
Guess Delbert C and Guess Gwendolyn F
Create a Home Valuation Report for This Property
The Home Valuation Report is an in-depth analysis detailing your home's value as well as a comparison with similar homes in the area
Home Values in the Area
Average Home Value in this Area
Purchase History
| Date | Buyer | Sale Price | Title Company |
|---|---|---|---|
| Radley William Jefferson | -- | Rogers County Abstract Co | |
| Radley William | $252,000 | None Available | |
| Guess Delbert C | $10,000 | -- |
Source: Public Records
Mortgage History
| Date | Status | Borrower | Loan Amount |
|---|---|---|---|
| Open | Radley William Jefferson | $159,800 | |
| Closed | Radley William | $201,600 |
Source: Public Records
Tax History Compared to Growth
Tax History
| Year | Tax Paid | Tax Assessment Tax Assessment Total Assessment is a certain percentage of the fair market value that is determined by local assessors to be the total taxable value of land and additions on the property. | Land | Improvement |
|---|---|---|---|---|
| 2025 | $3,123 | $35,356 | $5,361 | $29,995 |
| 2024 | $2,986 | $33,672 | $4,192 | $29,480 |
| 2023 | $2,986 | $32,069 | $3,479 | $28,590 |
| 2022 | $2,803 | $30,542 | $3,479 | $27,063 |
| 2021 | $2,565 | $29,087 | $3,479 | $25,608 |
| 2020 | $2,594 | $28,556 | $3,423 | $25,133 |
| 2019 | $2,430 | $27,135 | $3,311 | $23,824 |
| 2018 | $2,528 | $27,895 | $3,311 | $24,584 |
| 2017 | $2,465 | $27,615 | $3,311 | $24,304 |
| 2016 | $1,754 | $20,740 | $1,757 | $18,983 |
| 2015 | $1,821 | $20,740 | $1,815 | $18,925 |
| 2014 | $1,821 | $20,740 | $1,796 | $18,944 |
Source: Public Records
Map
Nearby Homes
- 13414 E 463 Rd
- 2701 Spring Creek St
- 18774 S Birch Hollow Way
- 17995 S 4160 Rd
- 18910 S Canyon Creek Rd
- 18954 S Hisaw Dr
- E E 470 Rd
- 531 Buckingham Dr
- 1921 Bristol Rd
- 19434 S Quail Run Ct
- 17090 S 4170 Rd
- 17811 S 4150 Rd
- 19805 S Lake Dr
- 326 E 15th St
- 1411 N Choctaw Place
- 14800 Cedar Dr
- 1402 N Dorothy Ave
- 1403 N Louisville Ave
- 2403 N Jay St
- 1335 N Mcfarland Place
- 13483 E 463 Rd
- 18455 S Highway 66
- 13405 E 463 Rd
- 13535 E 463 Rd
- 13560 E 463 Rd
- 13500 E 463 Rd
- 13555 E 463 Rd
- 18435 S Highway 66
- 18455 U S Route 66
- 18555 S Highway 66
- 18505 S Highway 66
- 18303 S Highway 66
- 18445 S Hwy 66
- 18303 U S Route 66
- 13559 E 463 Rd
- 18585 S Highway 66
- 18555 U S Route 66
- 18832 S Hisaw Dr
- 18635 S Highway 66
- 18715 Spring Creek Ln