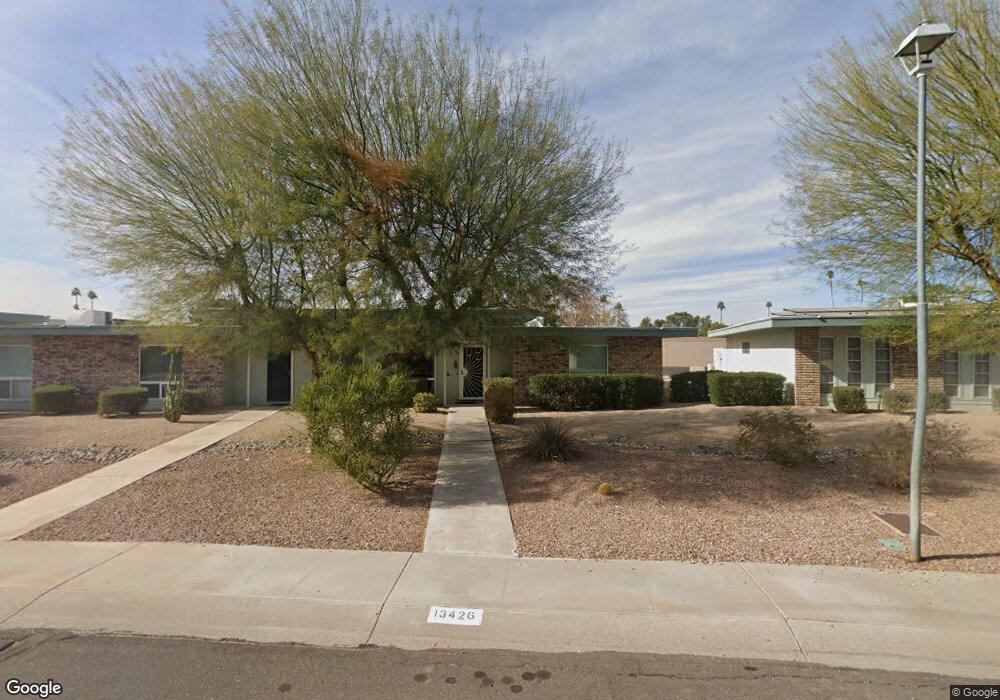
13426 N 100th Ave Sun City, AZ 85351
Estimated Value: $181,036 - $239,000
--
Bed
2
Baths
1,318
Sq Ft
$165/Sq Ft
Est. Value
About This Home
This home is located at 13426 N 100th Ave, Sun City, AZ 85351 and is currently estimated at $217,009, approximately $164 per square foot. 13426 N 100th Ave is a home located in Maricopa County with nearby schools including Desert Mirage Elementary School, Ombudsman - Northwest Charter, and Peoria Accelerated High School.
Ownership History
Date
Name
Owned For
Owner Type
Purchase Details
Closed on
May 13, 2021
Sold by
Nixon Nancy B and Nixon Nancy B
Bought by
Nixon Nancy
Current Estimated Value
Home Financials for this Owner
Home Financials are based on the most recent Mortgage that was taken out on this home.
Original Mortgage
$97,500
Outstanding Balance
$73,188
Interest Rate
3%
Mortgage Type
New Conventional
Estimated Equity
$143,821
Purchase Details
Closed on
Mar 3, 2004
Sold by
Brewer Daniel D
Bought by
Nixon Nancy B and Case #Pb 2003-070199
Home Financials for this Owner
Home Financials are based on the most recent Mortgage that was taken out on this home.
Original Mortgage
$76,000
Interest Rate
5.61%
Mortgage Type
Seller Take Back
Purchase Details
Closed on
Oct 6, 1999
Sold by
Brewer Daniel D
Bought by
Brewer Daniel D and The Daniel D Brewer Trust
Purchase Details
Closed on
Jun 4, 1996
Sold by
Myrick Patrick L and Brewer Daniel D
Bought by
Myrick Patrick L and Brewer Daniel D
Create a Home Valuation Report for This Property
The Home Valuation Report is an in-depth analysis detailing your home's value as well as a comparison with similar homes in the area
Home Values in the Area
Average Home Value in this Area
Purchase History
| Date | Buyer | Sale Price | Title Company |
|---|---|---|---|
| Nixon Nancy | -- | Fidelity National Title | |
| Nixon Nancy B | $84,000 | Capital Title Agency Inc | |
| Brewer Daniel D | -- | Capital Title Agency | |
| Myrick Patrick L | -- | United Title Agency |
Source: Public Records
Mortgage History
| Date | Status | Borrower | Loan Amount |
|---|---|---|---|
| Open | Nixon Nancy | $97,500 | |
| Previous Owner | Nixon Nancy B | $76,000 |
Source: Public Records
Tax History Compared to Growth
Tax History
| Year | Tax Paid | Tax Assessment Tax Assessment Total Assessment is a certain percentage of the fair market value that is determined by local assessors to be the total taxable value of land and additions on the property. | Land | Improvement |
|---|---|---|---|---|
| 2025 | $659 | $7,697 | -- | -- |
| 2024 | $595 | $7,330 | -- | -- |
| 2023 | $595 | $16,500 | $3,300 | $13,200 |
| 2022 | $567 | $14,030 | $2,800 | $11,230 |
| 2021 | $579 | $12,770 | $2,550 | $10,220 |
| 2020 | $565 | $11,180 | $2,230 | $8,950 |
| 2019 | $552 | $9,850 | $1,970 | $7,880 |
| 2018 | $528 | $8,660 | $1,730 | $6,930 |
| 2017 | $510 | $7,330 | $1,460 | $5,870 |
| 2016 | $480 | $5,980 | $1,190 | $4,790 |
| 2015 | $459 | $6,080 | $1,210 | $4,870 |
Source: Public Records
Map
Nearby Homes
- 13428 N 100th Ave
- 10019 W Thunderbird Blvd
- 9935 W Thunderbird Blvd
- 13433 N Emberwood Dr
- 10038 W Lancaster Dr
- 10072 W Lancaster Dr Unit 24B
- 13605 N Redwood Dr
- 13222 N 99th Dr
- 13606 N Redwood Dr Unit 209
- 13420 N Emberwood Dr
- 13080 N 99th Dr Unit D
- 13442 N Emberwood Dr
- 10050 W Lancaster Dr
- 13233 N 99th Dr Unit 24B
- 13614 N Hawthorn Dr
- 9960 W Forrester Dr
- 9971 W Bolivar Dr
- 13620 N Hawthorn Dr
- 13636 N Redwood Dr Unit 203
- 13081 N 100th Ave
- 13424 N 100th Ave
- 13422 N 100th Ave
- 10021 W Thunderbird Blvd
- 13430 N 100th Ave
- 13420 N 100th Ave
- 10019 W Thunderbird Blvd Unit A
- 10023 W Thunderbird Blvd
- 10017 W Thunderbird Blvd Unit 24B
- 13432 N 100th Ave
- 13418 N 100th Ave
- 10025 W Thunderbird Blvd
- 10015 W Thunderbird Blvd
- 9955 W Thunderbird Blvd
- 13434 N 100th Ave
- 13416 N 100th Ave
- 13416 N 100th Ave
- 9957 W Thunderbird Blvd
- 13211 N 100th Ave Unit 24B
- 13209 N 100th Ave
- 13412 N Hawthorn Dr