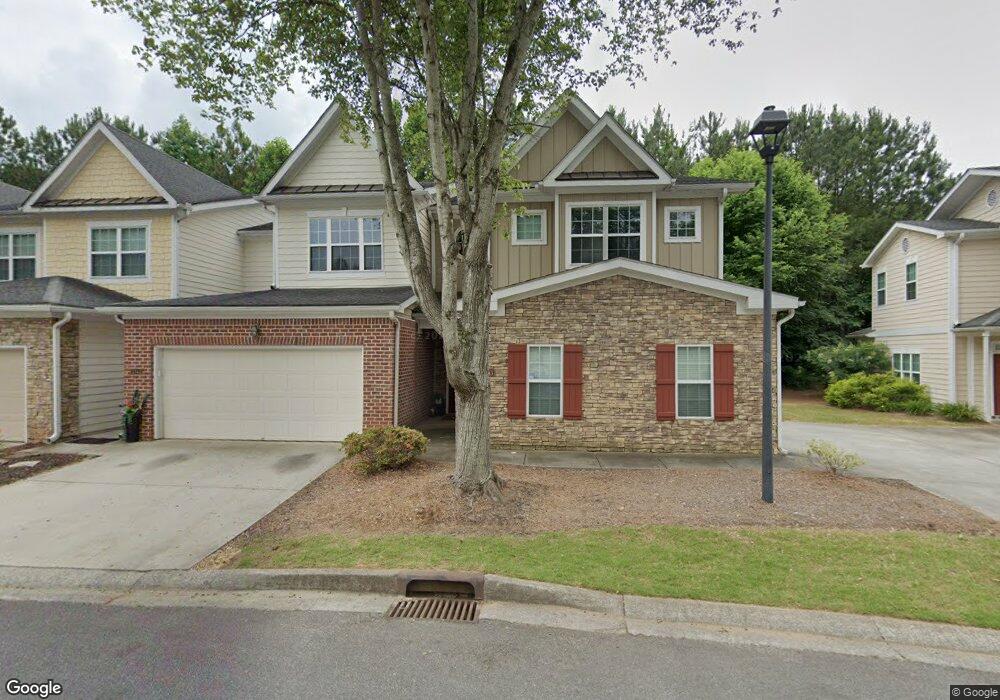
1343 Bexley Place NW Unit 17 Kennesaw, GA 30144
Estimated Value: $351,274 - $363,000
3
Beds
3
Baths
2,048
Sq Ft
$176/Sq Ft
Est. Value
About This Home
This home is located at 1343 Bexley Place NW Unit 17, Kennesaw, GA 30144 and is currently estimated at $359,569, approximately $175 per square foot. 1343 Bexley Place NW Unit 17 is a home located in Cobb County with nearby schools including Kennesaw Elementary School, Big Shanty Elementary School, and Palmer Middle School.
Ownership History
Date
Name
Owned For
Owner Type
Purchase Details
Closed on
Dec 30, 2019
Sold by
Blanchard Cara Wright
Bought by
Stark Stephen and Jorgensen Kari
Current Estimated Value
Home Financials for this Owner
Home Financials are based on the most recent Mortgage that was taken out on this home.
Original Mortgage
$217,979
Outstanding Balance
$192,180
Interest Rate
3.6%
Mortgage Type
FHA
Estimated Equity
$167,389
Purchase Details
Closed on
Mar 6, 2009
Sold by
Zaremba Barrett Llc
Bought by
Chavarria Francisco F
Home Financials for this Owner
Home Financials are based on the most recent Mortgage that was taken out on this home.
Original Mortgage
$137,700
Interest Rate
5.24%
Mortgage Type
Stand Alone Second
Purchase Details
Closed on
Jan 16, 2009
Sold by
Zaremba Barrett Llc
Bought by
Wright Caral L
Home Financials for this Owner
Home Financials are based on the most recent Mortgage that was taken out on this home.
Original Mortgage
$137,700
Interest Rate
5.24%
Mortgage Type
Stand Alone Second
Create a Home Valuation Report for This Property
The Home Valuation Report is an in-depth analysis detailing your home's value as well as a comparison with similar homes in the area
Home Values in the Area
Average Home Value in this Area
Purchase History
| Date | Buyer | Sale Price | Title Company |
|---|---|---|---|
| Stark Stephen | $222,000 | -- | |
| Chavarria Francisco F | $114,000 | -- | |
| Wright Caral L | $153,000 | -- |
Source: Public Records
Mortgage History
| Date | Status | Borrower | Loan Amount |
|---|---|---|---|
| Open | Stark Stephen | $217,979 | |
| Previous Owner | Wright Caral L | $137,700 |
Source: Public Records
Tax History Compared to Growth
Tax History
| Year | Tax Paid | Tax Assessment Tax Assessment Total Assessment is a certain percentage of the fair market value that is determined by local assessors to be the total taxable value of land and additions on the property. | Land | Improvement |
|---|---|---|---|---|
| 2025 | $1,041 | $148,560 | $28,000 | $120,560 |
| 2024 | $1,044 | $148,560 | $28,000 | $120,560 |
| 2023 | $756 | $121,144 | $28,000 | $93,144 |
| 2022 | $933 | $111,540 | $22,000 | $89,540 |
| 2021 | $865 | $88,684 | $18,000 | $70,684 |
| 2020 | $865 | $88,684 | $18,000 | $70,684 |
| 2019 | $2,155 | $80,868 | $18,000 | $62,868 |
| 2018 | $1,894 | $71,428 | $17,200 | $54,228 |
| 2017 | $1,797 | $71,428 | $17,200 | $54,228 |
| 2016 | $1,630 | $65,596 | $17,200 | $48,396 |
| 2015 | $1,403 | $56,444 | $14,400 | $42,044 |
| 2014 | $1,415 | $56,444 | $0 | $0 |
Source: Public Records
Map
Nearby Homes
- 1327 Bexley Place NW Unit 6
- 1241 Gates Mill Dr NW Unit 13
- 1212 Gates Mill Dr NW
- 1414 Dolcetto Trace NW Unit 14
- 1384 Dolcetto Trace NW
- 1376 Dolcetto Trace NW Unit 10
- 1186 Ridenour Blvd NW Unit 5
- 1466 Dolcetto Trace NW Unit 18
- 1177 Ridenour Blvd NW Unit 6
- 1827 Willow Branch Ln NW Unit M
- 1233 Ridenour Ln
- 1511 Dolcetto Trace NW Unit 1
- 1629 Marsanne Terrace NW
- 1629 Marsanne Terrace NW Unit 28
- 1776 Willow Branch Ln NW Unit E
- 1729 Ridenour Pkwy NW Unit 1
- 1646 Perserverence Hill Cir NW Unit 2
- 1605 Ridenour Pkwy NW Unit 1
- 1343 Bexley Place NW Unit 5
- 1339 Bexley Place NW Unit 5
- 1341 Bexley Place NW
- 1347 Bexley Place NW Unit 4
- 1347 Bexley Place NW
- 1337 Bexley Place NW Unit 5
- 1337 Bexley Place NW Unit 1337
- 1337 Bexley Place NW
- 1349 Bexley Place NW Unit 4
- 1349 Bexley Place NW
- 1351 Bexley Place NW Unit 4
- 1342 Bexley Place NW Unit 10
- 1342 Bexley Place NW
- 1344 Bexley Place NW Unit 10
- 1344 Bexley Place NW
- 1353 Bexley Place NW Unit 4
- 1340 Bexley Place NW Unit 40
- 1340 Bexley Place NW Unit 10
- 1333 Bexley Place NW Unit 21
- 1333 Bexley Place NW Unit 6