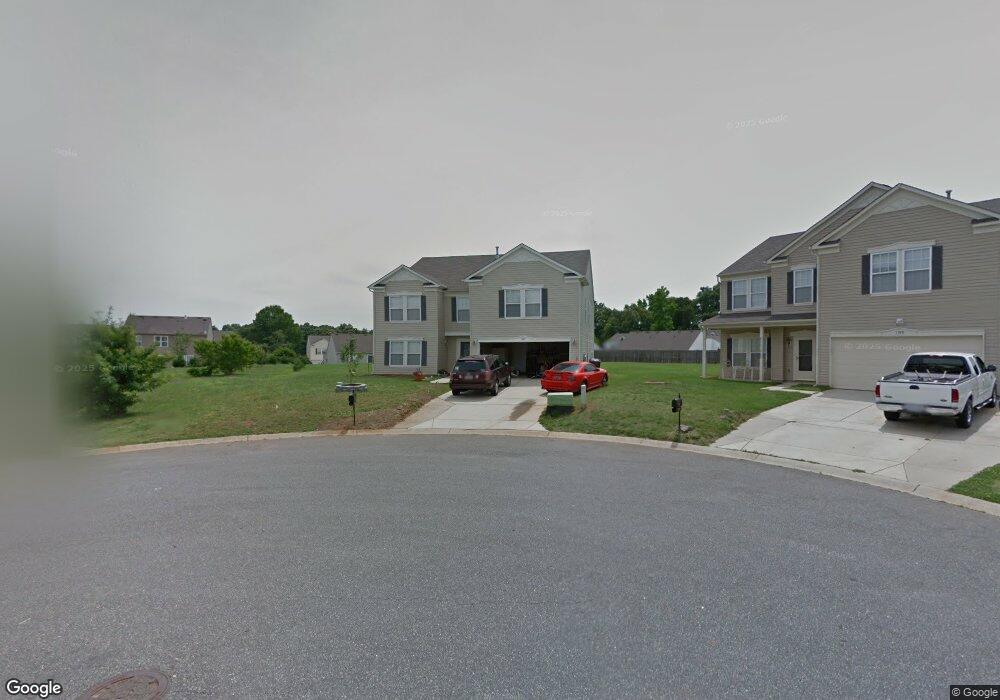
1343 Dunmore Ct Clover, SC 29710
Estimated Value: $378,000 - $464,000
Studio
1
Bath
3,608
Sq Ft
$118/Sq Ft
Est. Value
About This Home
This home is located at 1343 Dunmore Ct, Clover, SC 29710 and is currently estimated at $426,854, approximately $118 per square foot. 1343 Dunmore Ct is a home located in York County with nearby schools including Griggs Road Elementary School, Clover Middle School, and Clover High School.
Ownership History
Date
Name
Owned For
Owner Type
Purchase Details
Closed on
Feb 21, 2012
Sold by
Fannie Mae
Bought by
Frey Christina E
Current Estimated Value
Home Financials for this Owner
Home Financials are based on the most recent Mortgage that was taken out on this home.
Original Mortgage
$146,197
Outstanding Balance
$100,324
Interest Rate
4%
Mortgage Type
FHA
Estimated Equity
$326,530
Purchase Details
Closed on
Aug 11, 2011
Sold by
Gillespie John R and Gillespie Marguerite
Bought by
Fannie Mae and Federal National Mortgage Association
Purchase Details
Closed on
Oct 20, 2005
Sold by
C P Morgan Communities Of Charlotte Llc
Bought by
Henderson Brian K and Henderson Dorothy
Home Financials for this Owner
Home Financials are based on the most recent Mortgage that was taken out on this home.
Original Mortgage
$189,800
Interest Rate
7%
Mortgage Type
Adjustable Rate Mortgage/ARM
Purchase Details
Closed on
Aug 4, 2005
Sold by
The Matherson Co Inc
Bought by
C P Morgan Communities Of Charlotte Llc
Create a Home Valuation Report for This Property
The Home Valuation Report is an in-depth analysis detailing your home's value as well as a comparison with similar homes in the area
Home Values in the Area
Average Home Value in this Area
Purchase History
| Date | Buyer | Sale Price | Title Company |
|---|---|---|---|
| Frey Christina E | $150,000 | -- | |
| Fannie Mae | $222,413 | -- | |
| Henderson Brian K | $189,800 | -- | |
| C P Morgan Communities Of Charlotte Llc | $466,267 | -- |
Source: Public Records
Mortgage History
| Date | Status | Borrower | Loan Amount |
|---|---|---|---|
| Open | Frey Christina E | $146,197 | |
| Previous Owner | Henderson Brian K | $189,800 |
Source: Public Records
Tax History
| Year | Tax Paid | Tax Assessment Tax Assessment Total Assessment is a certain percentage of the fair market value that is determined by local assessors to be the total taxable value of land and additions on the property. | Land | Improvement |
|---|---|---|---|---|
| 2025 | $1,249 | $9,125 | $1,134 | $7,991 |
| 2024 | $1,121 | $7,935 | $1,215 | $6,720 |
| 2023 | $1,150 | $7,935 | $1,215 | $6,720 |
| 2022 | $947 | $7,935 | $1,215 | $6,720 |
| 2021 | -- | $7,935 | $1,215 | $6,720 |
| 2020 | $898 | $7,935 | $0 | $0 |
| 2019 | $852 | $6,900 | $0 | $0 |
| 2018 | $856 | $6,900 | $0 | $0 |
| 2017 | $798 | $6,900 | $0 | $0 |
| 2016 | $751 | $6,900 | $0 | $0 |
| 2014 | $3,784 | $6,900 | $1,000 | $5,900 |
| 2013 | $3,784 | $8,380 | $1,200 | $7,180 |
Source: Public Records
Map
Nearby Homes
- 1114 Fenwick Ct
- 1300 Dunmore Ct
- 917 Poplar Forest Ridge
- 148 Longlea Dr
- 144 Longlea Dr
- 2527 Courtland Dr
- 2409 Grinstead Ct
- 3217 Thorpe Ln
- 2838 Kinloch Ct
- 2104 Gillette Dr
- 1817 Tradd Ave
- 1806 Tradd Ave
- 1288 Century Dr
- 1219 Century Dr
- 507 Zoe Bee Dr
- 672 Cassidy Ct
- 664 Cassidy Ct
- 660 Cassidy Ct
- 656 Cassidy Ct
- 645 Cassidy Ct
- 1348 Dunmore Ct
- 1529 Morning Dove Way
- 1339 Dunmore Ct
- 1705 Grove Tree Ln
- 1525 Morning Dove Way
- 1535 Morning Dove Way
- 1342 Dunmore Ct
- 1709 Grove Tree Ln
- 1521 Morning Dove Way
- 1713 Grove Tree Ln
- 1338 Dunmore Ct
- 1335 Dunmore Ct
- 1334 Dunmore Ct
- 1528 Morning Dove Way
- 1517 Morning Dove Way
- 1532 Morning Dove Way
- 1704 Grove Tree Ln
- 1536 Morning Dove Way
- 1717 Grove Tree Ln
- 1513 Morning Dove Way
Your Personal Tour Guide
Ask me questions while you tour the home.