1343 SW 41st St Pendleton, OR 97801
Estimated Value: $413,634 - $437,000
4
Beds
2
Baths
2,000
Sq Ft
$212/Sq Ft
Est. Value
About This Home
This home is located at 1343 SW 41st St, Pendleton, OR 97801 and is currently estimated at $424,659, approximately $212 per square foot. 1343 SW 41st St is a home located in Umatilla County with nearby schools including McKay Creek Elementary School, Sunridge Middle School, and Pendleton High School.
Ownership History
Date
Name
Owned For
Owner Type
Purchase Details
Closed on
Jul 27, 2011
Sold by
Vanwagoner Mark and Vanwagoner Kathleen H
Bought by
Smith Kristopher A and Smith Stephanie A
Current Estimated Value
Home Financials for this Owner
Home Financials are based on the most recent Mortgage that was taken out on this home.
Original Mortgage
$185,250
Outstanding Balance
$127,605
Interest Rate
4.46%
Mortgage Type
New Conventional
Estimated Equity
$297,054
Purchase Details
Closed on
Nov 9, 2009
Sold by
Murphy Family Trust
Bought by
Vanwagoner Mark and Vanwagoner Kathleen H
Home Financials for this Owner
Home Financials are based on the most recent Mortgage that was taken out on this home.
Original Mortgage
$171,830
Interest Rate
4.92%
Mortgage Type
FHA
Purchase Details
Closed on
Feb 18, 2005
Sold by
Smith T Blair and Smith Karen K
Bought by
Smith Timothy B and Smith Karen K
Home Financials for this Owner
Home Financials are based on the most recent Mortgage that was taken out on this home.
Original Mortgage
$14,207
Interest Rate
5.73%
Mortgage Type
Stand Alone Second
Create a Home Valuation Report for This Property
The Home Valuation Report is an in-depth analysis detailing your home's value as well as a comparison with similar homes in the area
Home Values in the Area
Average Home Value in this Area
Purchase History
| Date | Buyer | Sale Price | Title Company |
|---|---|---|---|
| Smith Kristopher A | $195,000 | Pioneer Title Co | |
| Vanwagoner Mark | $175,000 | Pioneer Title Co | |
| Smith Timothy B | -- | Amerititle |
Source: Public Records
Mortgage History
| Date | Status | Borrower | Loan Amount |
|---|---|---|---|
| Open | Smith Kristopher A | $185,250 | |
| Previous Owner | Vanwagoner Mark | $171,830 | |
| Previous Owner | Smith Timothy B | $14,207 | |
| Previous Owner | Smith Timothy B | $154,000 |
Source: Public Records
Tax History Compared to Growth
Tax History
| Year | Tax Paid | Tax Assessment Tax Assessment Total Assessment is a certain percentage of the fair market value that is determined by local assessors to be the total taxable value of land and additions on the property. | Land | Improvement |
|---|---|---|---|---|
| 2024 | $4,893 | $261,220 | $44,980 | $216,240 |
| 2023 | $4,775 | $253,620 | $43,670 | $209,950 |
| 2022 | $3,214 | $175,750 | $0 | $0 |
| 2021 | $3,233 | $170,640 | $41,170 | $129,470 |
| 2020 | $3,120 | $165,670 | $39,970 | $125,700 |
| 2018 | $2,896 | $156,170 | $37,670 | $118,500 |
| 2017 | $2,871 | $151,630 | $36,570 | $115,060 |
| 2016 | $2,681 | $147,220 | $35,510 | $111,710 |
| 2015 | $2,798 | $134,740 | $32,500 | $102,240 |
| 2014 | $2,634 | $134,740 | $32,500 | $102,240 |
Source: Public Records
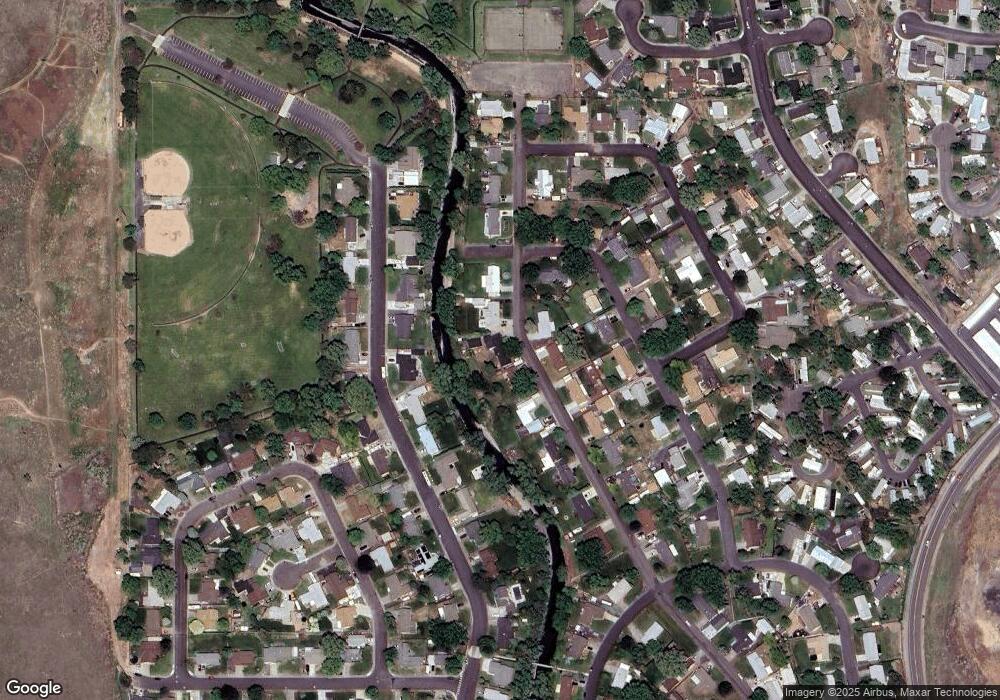
Map
Nearby Homes
- 1328 SW 44th St
- 1415 SW 44th St
- 1437 SW 40th St
- 1437 SW 37th St Unit 43
- 1511 SW 41st St
- 0 Mckay Dr
- 4226 SW Kirk Ave
- 0 SW Kirk Ave Unit 200 21392184
- 0 SW Kirk Ave Unit 101 21527345
- 0 SW Kirk Ave Unit 5500 21002117
- 3307 SW Kirk Ave
- 4032 SW Perkins Ave
- 3218 SW Isaac Ave
- 904 SW 43rd St
- 3108 SW Jay Ave
- 0 SW Ladow Ave Unit Lot 41
- 0 SW Ladow Ave Unit Lot 42
- 0 SW Ladow Ave Unit Lot 43
- 1023 SW 30th St
- 1309 SW 24th St
- 1351 SW 41st St
- 1335 SW 41st St
- 1330 SW 41st St
- 1359 SW 41st St
- 1322 SW 44th St
- 1327 SW 41st St
- 1334 SW 44th St
- 1410 SW 44th St
- 1308 SW 44th St
- 1307 SW 40th St
- 1350 SW 41st St
- 1403 SW 41st St
- 1323 SW 40th St
- 1416 SW 44th St
- 1333 SW 40th St
- 1325 SW 44th St
- 1402 SW 41st St
- 1302 SW 44th St
- 1341 SW 40th St
- 1321 SW 44th St