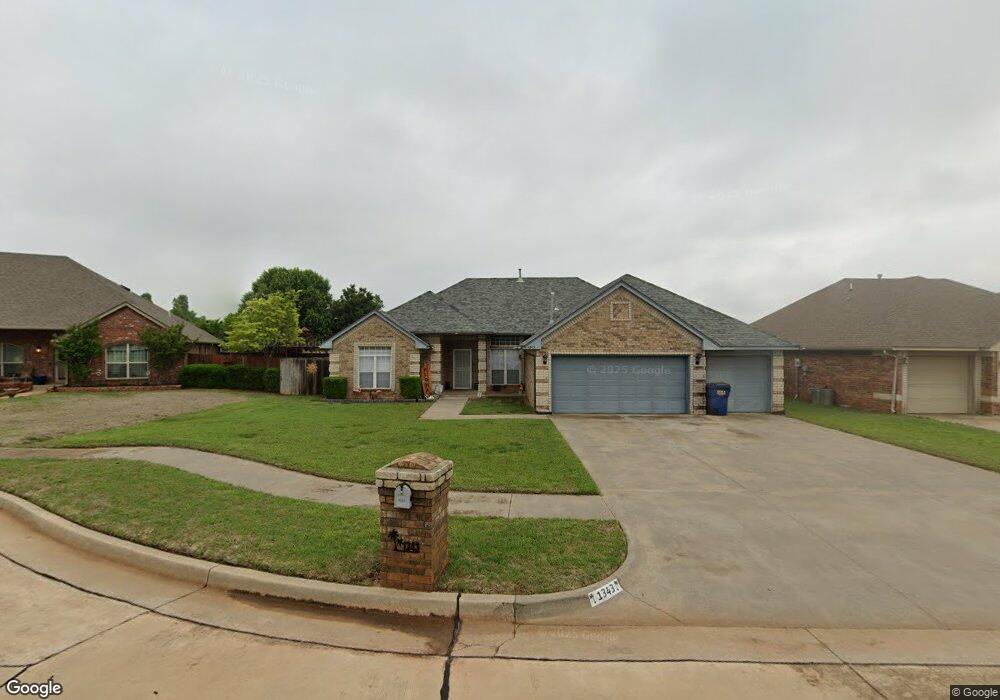
1343 W Emerald Way Mustang, OK 73064
Estimated Value: $294,244 - $345,000
4
Beds
2
Baths
2,230
Sq Ft
$142/Sq Ft
Est. Value
About This Home
This home is located at 1343 W Emerald Way, Mustang, OK 73064 and is currently estimated at $317,561, approximately $142 per square foot. 1343 W Emerald Way is a home located in Canadian County with nearby schools including Mustang Lakehoma Elementary School, Mustang Horizon Intermediate School, and Mustang Middle School.
Ownership History
Date
Name
Owned For
Owner Type
Purchase Details
Closed on
May 15, 2009
Sold by
Hays Bobbie D and Hays Wendy
Bought by
Sizemore Edwin Aaron and Sizemore Portia Jean M
Current Estimated Value
Home Financials for this Owner
Home Financials are based on the most recent Mortgage that was taken out on this home.
Original Mortgage
$184,907
Outstanding Balance
$116,766
Interest Rate
4.84%
Estimated Equity
$200,795
Purchase Details
Closed on
Feb 20, 2004
Sold by
Fleenor Enterprises Inc
Home Financials for this Owner
Home Financials are based on the most recent Mortgage that was taken out on this home.
Original Mortgage
$142,500
Interest Rate
5.86%
Purchase Details
Closed on
Sep 30, 2003
Sold by
Berkley,Alan D Trustee
Home Financials for this Owner
Home Financials are based on the most recent Mortgage that was taken out on this home.
Original Mortgage
$209,595
Interest Rate
6.25%
Create a Home Valuation Report for This Property
The Home Valuation Report is an in-depth analysis detailing your home's value as well as a comparison with similar homes in the area
Home Values in the Area
Average Home Value in this Area
Purchase History
| Date | Buyer | Sale Price | Title Company |
|---|---|---|---|
| Sizemore Edwin Aaron | $179,000 | Multiple | |
| -- | $150,000 | -- | |
| -- | $250,000 | -- |
Source: Public Records
Mortgage History
| Date | Status | Borrower | Loan Amount |
|---|---|---|---|
| Open | Sizemore Edwin Aaron | $184,907 | |
| Previous Owner | -- | $142,500 | |
| Previous Owner | -- | $209,595 |
Source: Public Records
Tax History Compared to Growth
Tax History
| Year | Tax Paid | Tax Assessment Tax Assessment Total Assessment is a certain percentage of the fair market value that is determined by local assessors to be the total taxable value of land and additions on the property. | Land | Improvement |
|---|---|---|---|---|
| 2024 | $2,363 | $25,423 | $2,626 | $22,797 |
| 2023 | $2,363 | $24,682 | $2,400 | $22,282 |
| 2022 | $2,319 | $23,964 | $2,400 | $21,564 |
| 2021 | $2,354 | $24,223 | $2,400 | $21,823 |
| 2020 | $2,361 | $24,149 | $2,400 | $21,749 |
| 2019 | $2,290 | $23,445 | $2,400 | $21,045 |
| 2018 | $2,301 | $23,074 | $2,400 | $20,674 |
| 2017 | $2,205 | $22,402 | $2,400 | $20,002 |
| 2016 | $2,142 | $22,402 | $2,400 | $20,002 |
| 2015 | $2,235 | $21,116 | $2,400 | $18,716 |
| 2014 | $2,235 | $22,522 | $2,400 | $20,122 |
Source: Public Records
Map
Nearby Homes
- 401 N Topaz Way
- 313 N Shannon Way
- 101 N Shannon Way
- 320 N Jasper Way
- 1316 W Harvard Way
- 1308 W Harvard Way
- 913 N Centennial Way
- 1401 W Harvard Way
- 520 S Owen Dr
- 1425 W Harvard Way
- 4408 Moonlight Rd
- 4213 Moonlight Rd
- 608 N White Tail Way
- 612 N White Tail Way
- 617 N White Tail Way
- 4716 Bermuda Dr
- 4601 Mustang Park Blvd
- 4712 Bermuda Dr
- 708 N Buckhorn Way
- 2001 W Crossbow Way
- 1339 W Emerald Way
- 1347 W Emerald Way
- 1340 W Agate Way
- 1336 Agate Way
- 1344 W Agate Way
- 1332 W Agate Way
- 309 N Emerald Way
- 304 N Emerald Way
- 316 N Amethyst Way
- 1336 W Emerald Way
- 1336 W Emerald Way
- 1336 W Emerald Way
- 1336 W Emerald Way
- 1336 W Emerald Way
- 305 N Emerald Way
- 308 N Amethyst Way
- 1332 W Emerald Way
- 300 N Emerald Way
- 301 N Emerald Way
- 1343 W Agate Way