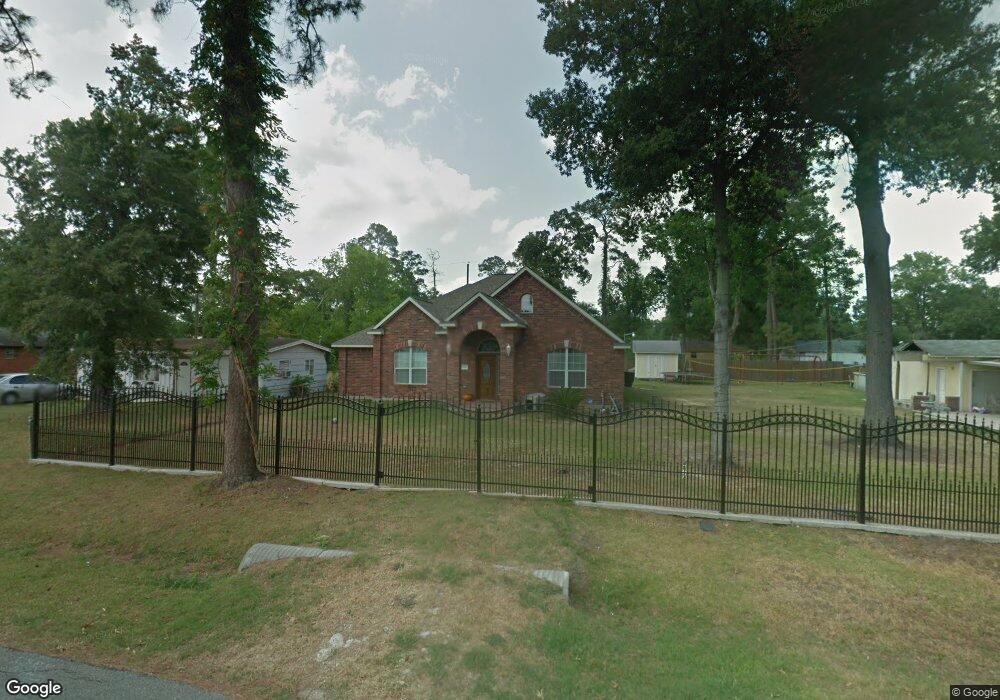
13437 Peoria St Houston, TX 77015
North Shore NeighborhoodEstimated Value: $129,000 - $153,000
2
Beds
1
Bath
877
Sq Ft
$162/Sq Ft
Est. Value
About This Home
This home is located at 13437 Peoria St, Houston, TX 77015 and is currently estimated at $141,683, approximately $161 per square foot. 13437 Peoria St is a home located in Harris County with nearby schools including Cimarron Elementary School, Cobb 6th Grade Campus, and North Shore Middle School.
Ownership History
Date
Name
Owned For
Owner Type
Purchase Details
Closed on
Nov 21, 2017
Sold by
Sheppey Land Company Llc
Bought by
Gonzalez Alfredo and Loya Brenda
Current Estimated Value
Home Financials for this Owner
Home Financials are based on the most recent Mortgage that was taken out on this home.
Original Mortgage
$35,550
Outstanding Balance
$29,868
Interest Rate
3.95%
Estimated Equity
$111,815
Purchase Details
Closed on
Aug 26, 2015
Sold by
Montes Alicia
Bought by
Montes Ricardo
Purchase Details
Closed on
Feb 2, 2015
Sold by
Gonzalez Gelacio and Gonzalez Leona
Bought by
Gonzalez Alfredo
Purchase Details
Closed on
May 6, 2014
Sold by
Chavez Arturo and Chavez Laura
Bought by
Gonzalez Gelacio and Gonzalez Leona
Purchase Details
Closed on
Feb 8, 2013
Sold by
Associates First Capital Corp
Bought by
Chavez Arturo and Chavez Laura
Create a Home Valuation Report for This Property
The Home Valuation Report is an in-depth analysis detailing your home's value as well as a comparison with similar homes in the area
Home Values in the Area
Average Home Value in this Area
Purchase History
| Date | Buyer | Sale Price | Title Company |
|---|---|---|---|
| Gonzalez Alfredo | -- | -- | |
| Montes Ricardo | -- | None Available | |
| Gonzalez Alfredo | -- | None Available | |
| Gonzalez Gelacio | -- | None Available | |
| Chavez Arturo | -- | None Available |
Source: Public Records
Mortgage History
| Date | Status | Borrower | Loan Amount |
|---|---|---|---|
| Open | Gonzalez Alfredo | $35,550 | |
| Closed | Gonzalez Alfredo | -- |
Source: Public Records
Tax History Compared to Growth
Tax History
| Year | Tax Paid | Tax Assessment Tax Assessment Total Assessment is a certain percentage of the fair market value that is determined by local assessors to be the total taxable value of land and additions on the property. | Land | Improvement |
|---|---|---|---|---|
| 2025 | $3,345 | $139,662 | $64,800 | $74,862 |
| 2024 | $3,345 | $136,276 | $64,800 | $71,476 |
| 2023 | $3,345 | $158,288 | $56,700 | $101,588 |
| 2022 | $3,324 | $128,894 | $48,600 | $80,294 |
| 2021 | $3,026 | $109,249 | $34,830 | $74,419 |
| 2020 | $2,706 | $95,469 | $34,830 | $60,639 |
| 2019 | $2,651 | $89,089 | $31,590 | $57,499 |
| 2018 | $920 | $58,507 | $17,415 | $41,092 |
| 2017 | $1,201 | $40,478 | $17,415 | $23,063 |
| 2016 | $1,201 | $40,478 | $17,415 | $23,063 |
| 2015 | $982 | $36,905 | $17,415 | $19,490 |
| 2014 | $982 | $33,103 | $17,415 | $15,688 |
Source: Public Records
Map
Nearby Homes
- 13430 Orleans St
- 13505 Orleans St
- 13362 Emporia St
- 13331 Emporia St
- 13326 Joliet St
- 13379 Louisville St
- 13842 Laredo St
- 13346 Louisville St
- 1035 Nadolney St
- 13430 Duluth St
- 13218 Indianapolis St
- 13434 Duluth St
- 13122 Emporia St
- 13350 Granada St
- 13522 Boise St
- 13529 Granada St
- 505 Evanston St
- TBD Gainesville St
- 530 Frankie St Unit 1
- 13351 Oak Leaf Ln
- 13425 Peoria St
- 13443 Peoria St
- 13443 Peoria St
- 13438 Orleans St
- 13442 Orleans St
- 13442 Orleans St Unit A
- 13502 Orleans St
- 13438 Peoria St
- 13442 Peoria St
- 13434 Peoria St
- 13506 Orleans St
- 13428 Peoria St
- 13454 Peoria St
- 13418 Orleans St
- 13426 Peoria St
- 13421 Peoria St
- 13421 Peoria St Unit 1
- 13510 Orleans St
- 13510 Orleans St
- 13456 Peoria St