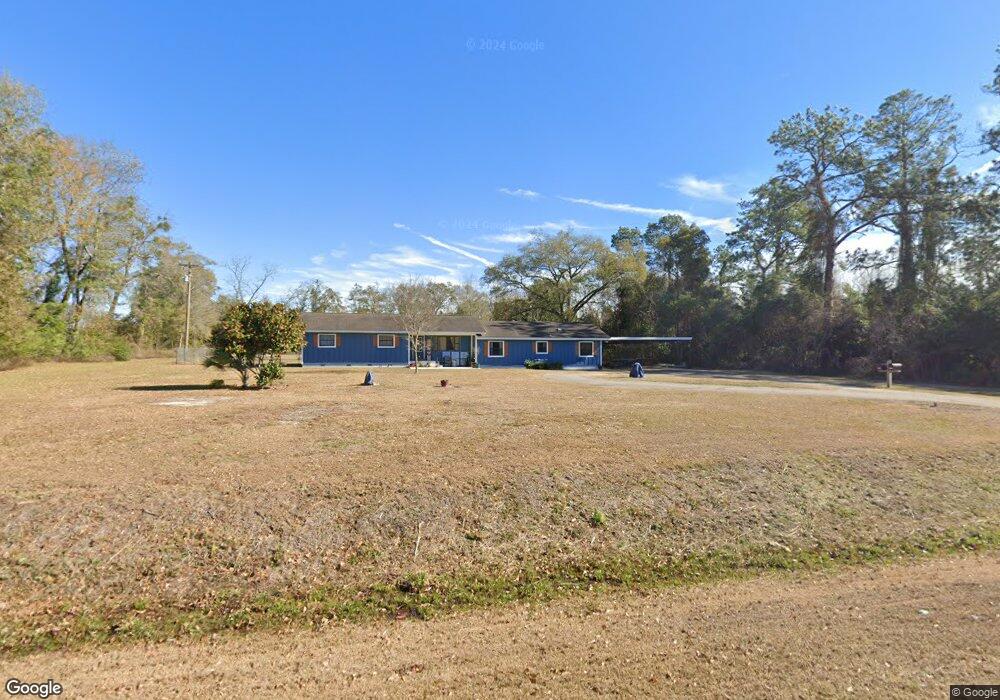
1344 Dillon Rd Thomasville, GA 31757
Estimated Value: $238,000 - $334,000
3
Beds
3
Baths
2,208
Sq Ft
$128/Sq Ft
Est. Value
About This Home
This home is located at 1344 Dillon Rd, Thomasville, GA 31757 and is currently estimated at $281,898, approximately $127 per square foot. 1344 Dillon Rd is a home located in Thomas County with nearby schools including Hand in Hand Primary School, Cross Creek Elementary School, and Garrison-Pilcher Elementary School.
Ownership History
Date
Name
Owned For
Owner Type
Purchase Details
Closed on
Mar 21, 2013
Sold by
Fewell Stephanie Michelle
Bought by
White Stephanie F
Current Estimated Value
Home Financials for this Owner
Home Financials are based on the most recent Mortgage that was taken out on this home.
Original Mortgage
$142,450
Outstanding Balance
$101,474
Interest Rate
3.75%
Mortgage Type
FHA
Estimated Equity
$180,424
Purchase Details
Closed on
May 27, 2011
Sold by
Moncrief Brenda Kay
Bought by
Fewell Stephanie Michelle
Purchase Details
Closed on
Jul 15, 2005
Sold by
Moncrief Bobby E
Bought by
Moncrief Bobby E and Heusner Linda Moncrief
Purchase Details
Closed on
May 14, 1961
Sold by
Nesmith Carrie Bell
Bought by
James R Nesmith
Purchase Details
Closed on
Apr 17, 1958
Sold by
Nesmith Carrie Bell
Bought by
Nesmith Carrie Bell
Create a Home Valuation Report for This Property
The Home Valuation Report is an in-depth analysis detailing your home's value as well as a comparison with similar homes in the area
Home Values in the Area
Average Home Value in this Area
Purchase History
| Date | Buyer | Sale Price | Title Company |
|---|---|---|---|
| White Stephanie F | -- | -- | |
| Fewell Stephanie Michelle | $141,000 | -- | |
| Moncrief Bobby E | -- | -- | |
| James R Nesmith | -- | -- | |
| Nesmith Carrie Bell | -- | -- |
Source: Public Records
Mortgage History
| Date | Status | Borrower | Loan Amount |
|---|---|---|---|
| Open | White Stephanie F | $142,450 |
Source: Public Records
Tax History Compared to Growth
Tax History
| Year | Tax Paid | Tax Assessment Tax Assessment Total Assessment is a certain percentage of the fair market value that is determined by local assessors to be the total taxable value of land and additions on the property. | Land | Improvement |
|---|---|---|---|---|
| 2024 | $1,428 | $70,042 | $10,957 | $59,085 |
| 2023 | $1,291 | $64,793 | $8,765 | $56,028 |
| 2022 | $1,305 | $59,166 | $8,765 | $50,401 |
| 2021 | $1,249 | $51,372 | $7,622 | $43,750 |
| 2020 | $1,281 | $51,287 | $7,622 | $43,665 |
| 2019 | $1,295 | $51,287 | $7,622 | $43,665 |
| 2018 | $1,318 | $51,113 | $7,622 | $43,491 |
| 2017 | $1,234 | $47,196 | $7,622 | $39,574 |
| 2016 | $1,236 | $46,880 | $7,622 | $39,258 |
| 2015 | $1,350 | $50,216 | $7,622 | $42,594 |
| 2014 | $1,233 | $45,757 | $7,622 | $38,135 |
| 2013 | -- | $46,265 | $7,622 | $38,643 |
Source: Public Records
Map
Nearby Homes
- 148 Cypress Ln
- 13310 N Us Hwy 319
- 0000 Sanford Road (47 83 Acres)
- 113 Lost Creek Ln
- 125 Lost Creek Ln
- 220 Dillon Rd
- 220 Dillon Rd (28 Acres)
- 221 Ginger Ln
- 107 Andee Way
- 12112 Us Highway 319 N
- 120 Kelon Dr
- 108 Kelon Dr
- 102 Palm Island Dr
- 109 Jordan Dr
- 104 Palm Island Dr
- 108 Palm Island Dr
- 1327 Hall Rd
- 110 Palm Island Dr
- 115 Jordan Dr
- 4131 Ga Hwy 122